Live Market - Performance MonitorLive Market — Performance Monitor
Study material (no code) — step-by-step training guide for learners
________________________________________
1) What this tool is — short overview
This indicator is a live market performance monitor designed for learning. It scans price, volume and volatility, detects order blocks and trendline events, applies filters (volume & ATR), generates trade signals (BUY/SELL), creates simple TP/SL trade management, and renders a compact dashboard summarizing market state, risk and performance metrics.
Use it to learn how multi-factor signals are constructed, how Greeks-style sensitivity is replaced by volatility/ATR reasoning, and how a live dashboard helps monitor trade quality.
________________________________________
2) Quick start — how a learner uses it (step-by-step)
1. Add the indicator to a chart (any ticker / timeframe).
2. Open inputs and review the main groups: Order Block, Trendline, Signal Filters, Display.
3. Start with defaults (OB periods ≈ 7, ATR multiplier 0.5, volume threshold 1.2) and observe the dashboard on the last bar.
4. Walk the chart back in time (use the last-bar update behavior) and watch how signals, order blocks, trendlines, and the performance counters change.
5. Run the hands-on labs below to build intuition.
________________________________________
3) Main configurable inputs (what you can tweak)
• Order Block Relevant Periods (default ~7): number of consecutive candles used to define an order block.
• Min. Percent Move for Valid OB (threshold): minimum percent move required for a valid order block.
• Number of OB Channels: how many past order block lines to keep visible.
• Trendline Period (tl_period): pivot lookback for detecting highs/lows used to draw trendlines.
• Use Wicks for Trendlines: whether pivot uses wicks or body.
• Extension Bars: how far trendlines are projected forward.
• Use Volume Filter + Volume Threshold Multiplier (e.g., 1.2): requires volume to be greater than multiplier × average volume.
• Use ATR Filter + ATR Multiplier: require bar range > ATR × multiplier to filter noise.
• Show Targets / Table settings / Colors for visualization.
________________________________________
4) Core building blocks — what the script computes (plain language)
Price & trend:
• Spot / LTP: current close price.
• EMA 9 / 21 / 50: fast, medium, slow moving averages to define short/medium trend.
o trend_bullish: EMA9 > EMA21 > EMA50
o trend_bearish: EMA9 < EMA21 < EMA50
o trend_neutral: otherwise
Volatility & noise:
• ATR (14): average true range used for dynamic target and filter sizing.
• dynamic_zone = ATR × atr_multiplier: minimum bar range required for meaningful move.
• Annualized volatility: stdev of price changes × sqrt(252) × 100 — used to classify volatility (HIGH/MEDIUM/LOW).
Momentum & oscillators:
• RSI 14: overbought/oversold indicator (thresholds 70/30).
• MACD: EMA(12)-EMA(26) and a 9-period signal line; histogram used for momentum direction and strength.
• Momentum (ta.mom 10): raw momentum over 10 bars.
Mean reversion / band context:
• Bollinger Bands (20, 2σ): upper, mid, lower.
o price_position measures where price sits inside the band range as 0–100.
Volume metrics:
• avg_volume = SMA(volume, 20) and volume_spike = volume > avg_volume × volume_threshold
o volume_ratio = volume / avg_volume
Support & Resistance:
• support_level = lowest low over 20 bars
• resistance_level = highest high over 20 bars
• current_position = percent of price between support & resistance (0–100)
________________________________________
5) Order Block detection — concept & logic
What it tries to find: a bar (the base) followed by N candles in the opposite direction (a classical order block setup), with a minimum % move to qualify. The script records the high/low of the base candle, averages them, and plots those levels as OB channels.
How learners should think about it (conceptual):
1. An order block is a signature area where institutions (theory) left liquidity — often seen as a large bar followed by a sequence of directional candles.
2. This indicator uses a configurable number of subsequent candles to confirm that the pattern exists.
3. When found, it stores and displays the base candle’s high/low area so students can see how price later reacts to those zones.
Implementation note for learners: the tool keeps a limited history of OB lines (ob_channels). When new OBs exceed the count, the oldest lines are removed — good practice to avoid clutter.
________________________________________
6) Trendline detection — idea & interpretation
• The script finds pivot highs and lows using a symmetric lookback (tl_period and half that as right/left).
• It then computes a trendline slope from successive pivots and projects the line forward (extension_bars).
• Break detection: Resistance break = close crosses above the projected resistance line; Support break = close crosses below projected support.
Learning tip: trendlines here are computed from pivot points and time. Watch how changing tl_period (bigger = smoother, fewer pivots) alters the trendlines and break signals.
________________________________________
7) Signal generation & filters — step-by-step
1. Primary triggers:
o Bullish trigger: order block bullish OR resistance trendline break.
o Bearish trigger: bearish order block OR support trendline break.
2. Filters applied (both must pass unless disabled):
o Volume filter: volume must be > avg_volume × volume_threshold.
o ATR filter: bar range (high-low) must exceed ATR × atr_multiplier.
o Not in an existing trade: new trades only start if trade_active is false.
3. Trend confirmation:
o The primary trigger is only confirmed if trend is bullish/neutral for buys or bearish/neutral for sells (EMA alignment).
4. Result:
o When confirmed, a long or short trade is activated with TP/SL calculated from ATR multiples.
________________________________________
8) Trade management — what the tool does after a signal
• Entry management: the script marks a trade as trade_active and sets long_trade or short_trade flags.
• TP & SL rules:
o Long: TP = high + 2×ATR ; SL = low − 1×ATR
o Short: TP = low − 2×ATR ; SL = high + 1×ATR
• Monitoring & exit:
o A trade closes when price reaches TP or SL.
o When TP/SL hit, the indicator updates win_count and total_pnl using a very simple calculation (difference between TP/SL and previous close).
o Visual lines/labels are drawn for TP and updated as the trade runs.
Important learner notes:
• The script does not store a true entry price (it uses close in its P&L math), so PnL is an approximation — treat this as a learning proxy, not a position accounting system.
• There’s no sizing, slippage, or fee accounted — students must manually factor these when translating to real trades.
• This indicator is not a backtesting strategy; strategy.* functions would be needed for rigorous backtest results.
________________________________________
9) Signal strength & helper utilities
• Signal strength is a composite score (0–100) made up of four signals worth 25 points each:
1. RSI extreme (overbought/oversold) → 25
2. Volume spike → 25
3. MACD histogram magnitude increasing → 25
4. Trend existence (bull or bear) → 25
• Progress bars (text glyphs) are used to visually show RSI and signal strength on the table.
Learning point: composite scoring is a way to combine orthogonal signals — study how changing weights changes outcomes.
________________________________________
10) Dashboard — how to read each section (walkthrough)
The dashboard is split into sections; here's how to interpret them:
1. Market Overview
o LTP / Change%: immediate price & daily % change.
2. RSI & MACD
o RSI value plus progress bar (overbought 70 / oversold 30).
o MACD histogram sign indicates bullish/bearish momentum.
3. Volume Analysis
o Volume ratio (current / average) and whether there’s a spike.
4. Order Block Status
o Buy OB / Sell OB: the average base price of detected order blocks or “No Signal.”
5. Signal Status
o 🔼 BUY or 🔽 SELL if confirmed, or ⚪ WAIT.
o No-trade vs Active indicator summarizing market readiness.
6. Trend Analysis
o Trend direction (from EMAs), market sentiment score (composite), volatility level and band/position metrics.
7. Performance
o Win Rate = wins / signals (percentage)
o Total PnL = cumulative PnL (approximate)
o Bull / Bear Volume = accumulated volumes attributable to signals
8. Support & Resistance
o 20-bar highest/lowest — use as nearby reference points.
9. Risk & R:R
o Risk Level from ATR/price as a percent.
o R:R Ratio computed from TP/SL if a trade is active.
10. Signal Strength & Active Trade Status
• Numeric strength + progress bar and whether a trade is currently active with TP/SL display.
________________________________________
11) Alerts — what will notify you
The indicator includes pre-built alert triggers for:
• Bullish confirmed signal
• Bearish confirmed signal
• TP hit (long/short)
• SL hit (long/short)
• No-trade zone
• High signal strength (score > 75%)
Training use: enable alerts during a replay session to be notified when the indicator would have signalled.
________________________________________
12) Labs — hands-on exercises for learners (step-by-step)
Lab A — Order Block recognition
1. Pick a 15–30 minute timeframe on a liquid ticker.
2. Use default OB periods (7). Mark each time the dashboard shows a Buy/Sell OB.
3. Manually inspect the chart at the base candle and the following sequence — draw the OB zone by hand and watch later price reactions to it.
4. Repeat with OB periods 5 and 10; note stability vs noise.
Lab B — Trendline break confirmation
1. Increase trendline period (e.g., 20), watch trendlines form from pivots.
2. When a resistance break is flagged, compare with MACD & volume: was momentum aligned?
3. Note false breaks vs confirmed moves — change extension_bars to see projection effects.
Lab C — Filter sensitivity
1. Toggle Use Volume Filter off, and record the number and quality of signals in a 2-day window.
2. Re-enable volume filter and change threshold from 1.2 → 1.6; note how many low-quality signals are filtered out.
Lab D — Trade management simulation
1. For each signalled trade, record the time, close entry approximation, TP, SL, and eventual hit/miss.
2. Compute actual PnL if you had entered at the open of the next bar to compare with the script’s PnL math.
3. Tabulate win rate and average R:R.
Lab E — Performance review & improvement
1. Build a spreadsheet of signals over 30–90 periods with columns: Date, Signal type, Entry price (real), TP, SL, Exit, PnL, Notes.
2. Analyze which filters or indicators contributed most to winners vs losers and adjust weights.
________________________________________
13) Common pitfalls, assumptions & implementation notes (things to watch)
• P&L simplification: total_pnl uses close as a proxy entry price. Real entry/exit prices and slippage are not recorded — so PnL is approximate.
• No position sizing or money management: the script doesn’t compute position size from equity or risk percent.
• Signal confirmation logic: composite "signal_strength" is a simple 4×25 point scheme — explore different weights or additional signals.
• Order block detection nuance: the script defines the base candle and checks the subsequent sequence. Be sure to verify whether the intended candle direction (base being bullish vs bearish) aligns with academic/your trading definition — read the code carefully and test.
• Trendline slope over time: slope is computed using timestamps; small differences may make lines sensitive on very short timeframes — using bar_index differences is usually more stable.
• Not a true backtester: to evaluate performance statistically you must transform the logic into a strategy script that places hypothetical orders and records exact entry/exit prices.
________________________________________
14) Suggested improvements for advanced learners
• Record true entry price & timestamp for accurate PnL.
• Add position sizing: risk % per trade using SL distance and account size.
• Convert to strategy. (Pine Strategy)* to run formal backtests with equity curves, drawdowns, and metrics (Sharpe, Sortino).
• Log trades to an external spreadsheet (via alerts + webhook) for offline analysis.
• Add statistics: average win/loss, expectancy, max drawdown.
• Add additional filters: news time blackout, market session filters, multi-timeframe confirmation.
• Improve OB detection: combine wick/body, volume spike at base bar, and liquidity sweep detection.
________________________________________
15) Glossary — quick definitions
• ATR (Average True Range): measure of typical range; used to size targets and stops.
• EMA (Exponential Moving Average): trend smoothing giving more weight to recent prices.
• RSI (Relative Strength Index): momentum oscillator; >70 overbought, <30 oversold.
• MACD: momentum oscillator using difference of two EMAs.
• Bollinger Bands: volatility bands around SMA.
• Order Block: a base candle area with subsequent confirmation candles; a zone of institutional interest (learning model).
• Pivot High/Low: local turning point defined by candles on both sides.
• Signal Strength: combined score from multiple indicators.
• Win Rate: proportion of signals that hit TP vs total signals.
• R:R (Risk:Reward): ratio of potential reward (TP distance) to risk (entry to SL).
________________________________________
16) Limitations & assumptions (be explicit)
• This is an indicator for learning — not a trading robot or broker connection.
• No slippage, fees, commissions or tie-in to real orders are considered.
• The logic is heuristic (rule-of-thumb), not a guarantee of performance.
• Results are sensitive to timeframe, market liquidity, and parameter choices.
________________________________________
17) Practical classroom / study plan (4 sessions)
• Session 1 — Foundations: Understand EMAs, ATR, RSI, MACD, Bollinger Bands. Run the indicator and watch how these numbers change on a single day.
• Session 2 — Zones & Filters: Study order blocks and trendlines. Test volume & ATR filters and note changes in false signals.
• Session 3 — Simulated trading: Manually track 20 signals, compute real PnL and compare to the dashboard.
• Session 4 — Improvement plan: Propose changes (e.g., better PnL accounting, alternative OB rule) and test their impact.
________________________________________
18) Quick reference checklist for each signal
1. Was an order block or trendline break detected? (primary trigger)
2. Did volume meet threshold? (filter)
3. Did ATR filter (bar size) show a real move? (filter)
4. Was trend aligned (EMA 9/21/50)? (confirmation)
5. Signal confirmed → mark entry approximation, TP, SL.
6. Monitor dashboard (Signal Strength, Volatility, No-trade zone, R:R).
7. After exit, log real entry/exit, compute actual PnL, update spreadsheet.
________________________________________
19) Educational caveat & final note
This tool is built for training and analysis: it helps you see how common technical building blocks combine into trade ideas, but it is not a trading recommendation. Use it to develop judgment, to test hypotheses, and to design robust systems with proper backtesting and risk control before risking capital.
________________________________________
20) Disclaimer (must include)
Training & Educational Only — This material and the indicator are provided for educational purposes only. Nothing here is investment advice or a solicitation to buy or sell financial instruments. Past simulated or historical performance does not predict future results. Always perform full backtesting and risk management, and consider seeking advice from a qualified financial professional before trading with real capital.
________________________________________
In den Scripts nach "pivot points" suchen

RSI Divergence StrategyOverview
The RSI Divergence Strategy Indicator is a trading tool that uses the RSI and divergences created to generate high-probability buy and sell signals.
I have provided the best formula of numbers to use for BTC on a 30 minute timeframe.
You can change where on RSI you enter and exit both long or short trades. This way you can experiment on different tokens using different entry/exit points. Can use on multiple timeframes.
This strategy is designed to open and close long or short trades based on the levels you provide it. You can then check on the RSI where the best levels are for each token you want to trade and amend it as required to generate a profitable strategy.
How It Works
The RSI Divergence Strategy Indicator uses bear and bull divergences in conjuction with a level you have input on the RSI.
RSI for Overbought/Oversold:
• Input variables for entry and exit levels and when the entry levels combine with a bear or bull divergence signal, a trade is alerted.
RSI Divergence:
• Buy and sell signals are confirmed when the RSI creates bearish or bullish divergences and these divergences are in the same area as your levels you input for entry to short or long.
After 7 years of experience and testing I have calculated the exact numbers required and produced a formula to calculate the exact input variables for a 30 minute Bitcoin chart.
Key Features
1️⃣ Divergence Identification – Ensures trades are taken only when a bull or bear divergence has formed.
2️⃣ Overbought/Oversold Input Filtering – Set up your own variables on the RSI for different markets after identifying patterns on the RSI in relation to a bearish or bullish divergence.
3️⃣ Works on any chart – Suitable for all markets and timeframes once you input the correct variables for entry and exit levels.
How to Use
🟢 Basic Trading:
• Use on any timeframe.
• Enter trade only when alert has fired off. Close when it says to exit.
• Change entry and exit levels in the properties of the strategy indicator.
• Make entry and exit levels coincide with bearish or bullish divergences on the RSI.
Check the strategy tester to see backtesting so you know if the indicator is profitable or not for that market and timeframe as each crypto token is different and so is the timeframe you choose.
📢 Webhook Automation:
• Set up TradingView Alerts to auto-execute trades via Webhook-compatible platforms.
Key additions for divergence visualization:
Divergence Arrows:
Bullish divergence: Green label with white 'bull ' text
Bearish divergence: Red label with white 'bear' text
Positioned at the pivot point
Divergence Lines:
Connects consecutive RSI pivot points
Automatically drawn between consecutive pivot points
Enhanced RSI Coloring:
Overbought zone: Red
Oversold zone: Green
Neutral zone: Gray
The visualization helps you instantly spot:
Where divergences are forming on the RSI
The pattern of higher lows (bullish) or lower highs (bearish)
Contextual coloring of RSI relative to standard levels
All divergence markers appear at the correct historical pivot points, making it easy to visually confirm divergence patterns as they develop.
Strategy levels and background zones also shown to help visual look.
Why This Combination?
This indicator is just a simple RSI tool.
It is designed to filter out weak trades and only execute trades that have:
✅ RSI Divergence
✅ Overbought or Oversold Conditions
It does not calculate downtrends or bear markets so care is recommended taking long trades during these times.
Why It’s Worth Using?
📈 Open Source – Free to use and learn from.
📉 Long or Short Term Trading Style – Entry/Exit parameters options are designed for both short or long term trades allowing you to experiment until you find a profitable strategy for that market you want to trade.
📢 Seamless Webhook Automation – Execute trades automatically with TradingView alerts.
💲 Ready to trade smarter?
✅ Add the RSI Divergence Strategy Indicator to your TradingView chart.

Dow waveform analyzerDow Waveform Analyzer
1. Overview and Features of the Indicator
This indicator is a tool designed to analyze chart waveforms based on Dow Theory, identifying swing lows (support) and swing highs (resistance). It allows users to quickly and consistently determine trend direction. Compared to manual analysis, it provides more efficient and accurate results.
By using swing lows and swing highs, the indicator offers a more detailed understanding of trends than simple updates to highs and lows, aiding in the creation of effective trading strategies.
2. Identifying Wave Lows and Highs
Stock prices do not move in straight lines; instead, they rise and fall in waves. This indicator starts by identifying the wave lows and wave highs.
- Wave Low: The lowest point during a temporary price decline.
- Wave High: The highest point during a temporary price increase.
These are automatically identified using Pine Script’s built-in functions `pivotlow` and `pivothigh`.
3. Drawing the Waveform
The identified wave lows and highs are alternately connected to draw the waveform. However, there are cases where wave lows or highs occur consecutively:
- Consecutive Wave Lows: The lower low is used for drawing the waveform.
- Consecutive Wave Highs: The higher high is used for drawing the waveform.
4. Tracking Swing Lows/Highs and Trend Determination
Swing lows and swing highs are crucial markers that indicate the state of wave progression:
- Swing Low: The starting point of a wave (wave low) when the closing price exceeds the previous wave high.
- Swing High: The starting point of a wave (wave high) when the closing price falls below the previous wave low.
The changes in swing lows and swing highs as the waves progress allow for trend state determination.
5. Examples of Trend States
During an Uptrend:
- When the price surpasses a wave high, the swing low is updated, confirming the continuation of the uptrend.
End of an Uptrend:
- When the price falls below the swing low, the swing low disappears, and a swing high appears, signaling the end of the uptrend.
Sideways Movement:
- Swing lows and swing highs alternately appear, indicating a sideways trend.
Start of a Downtrend:
- When the price breaks below a wave low for the first time, the swing high is updated, confirming the start of the downtrend.
During a Downtrend:
- When the price breaks below a wave low, the swing high is updated, confirming the continuation of the downtrend.
End of a Downtrend:
- When the price surpasses a wave high, the swing high disappears, and a swing low reappears, signaling the end of the downtrend.
Restart of an Uptrend:
- When the swing low is updated, the uptrend resumes. The uptrend begins when the price surpasses a wave high, and the swing low is updated for the first time.
6. Applications
Trade Entries and Exits:
- Set stop orders for entry at the price level where a trend starts.
- Set stop orders for exit at the price level where a trend ends.
Trend Filtering:
- Use the indicator to confirm whether market conditions are suitable for entry based on the trend state. Analyze waveforms to aid trading strategies.
Guide for Drawing Trendlines:
- Utilize wave lows and highs as starting and ending points when drawing trendlines with drawing tools.
7. Parameters and Display Items
Pivot Points:
- Wave lows are marked with circles below the candlestick’s low, and wave highs are marked with circles above the candlestick’s high.
Number of Bars for Pivot Calculation:
- Specify the number of bars on either side used to identify highs (default: 2).
Waveform:
- Specify the color (default: blue) or toggle its visibility (default: visible).
Swing Lows/Highs:
- Displayed as large circles. The rightmost large circle on the chart indicates the current swing low or swing high. Historical swing points are also displayed to show the progression of state changes. Specify the color (default: green) or toggle visibility (default: visible).
1. インジケーターの概要と特徴
このインジケーターは、ダウ理論を基にチャートの波形を分析し、押し安値や戻り高値を特定するツールです。これにより、トレンドの方向を迅速かつ一貫して判断できます。手動での分析と比較して、効率的かつ精度の高い結果が得られる点が特徴です。
押し安値や戻り高値を利用することで、単純な高値・安値の更新よりも詳細にトレンドの状況を把握し、効果的な取引戦略の構築に役立ちます。
2. 波の谷と波の頂の特定
株価は直線的に動くのではなく、波を描きながら上昇や下落を繰り返します。このインジケーターは、まず波の谷と波の頂を特定するところから始まります。
波の谷: 一時的な下落の最安値
波の頂: 一時的な上昇の最高値
これらを Pine Script の内蔵関数(ピボットローとピボットハイ)を用いて自動的に特定しています。
3. 波形の描画方法
特定した波の谷と波の頂を交互に結んで波形を描画します。ただし、波の谷や頂が連続する場合があります。
波の谷が連続する場合: より低い谷を採用して波形を描く
波の頂が連続する場合: より高い頂を採用して波形を描く
4. 押し安値・戻り高値の追跡とトレンド判断
押し安値と戻り高値は、波の進行状況を示す重要な指標です。
押し安値: 終値が前回の高値を超えた際の波の谷
戻り高値: 終値が前回の安値を割り込んだ際の波の頂
波の進行に伴う押し安値・戻り高値の変化から、トレンドの状態を判断します。
5. トレンド状態の具体例
上昇トレンド中:
波の頂を株価が上抜け押し安値が更新され続けることで上昇トレンドを継続。
上昇トレンドの終了:
株価が押し安値を割ると、押し安値が消え、戻り高値が新たに出現して、上昇トレンドを終了。
横ばい状態:
押し安値と戻り高値が交互に切り替わる。
下降トレンドの開始:
波の谷を株価が下抜け戻り高値がはじめて更新されることで下降トレンド開始を確認。
下降トレンド中:
波の谷を株価が下抜け戻り高値が更新され続けることで下降トレンドを継続。
下降トレンドの終了:
株価が波の頂を超えると、戻り高値が消え、押し安値が再び出現して、下降トレンドを終了。
横ばい状態:
押し安値と戻り高値が交互に切り替わる。
上昇トレンドの再開:
押し安値が更新されることで上昇トレンドを確認。
波の頂を株価が上抜け押し安値がはじめて更新されることで上昇トレンド開始を確認。
6. 応用例
トレードのエントリーとエグジット:
トレンド発生の価格に逆指値を設定してエントリー。
トレンド終了の価格に逆指値を設定してエグジット。
トレンドフィルターとして活用:
エントリーに適したトレンド状況かを確認。波形を分析してトレード戦略の参考に。
トレンドラインを描く時の参考として活用:
波の谷と頂を描画ツールを使ってトレンドラインを描く時の起点や終点として活用。
7. パラメーターと表示項目
ピボット: 波の谷はローソク足の安値にサークルを表示、波の頂はローソク足の高値にサークルを表示。
ピボット計算用のバーの数: 高値を特定するために左右何本のローソク足を使用するかを設定(初期値: 2)。
波形: 色(初期値: 青)や表示(初期値: 表示)の指定。
押し安値・戻り高値: 大きなサークルで表示。チャートの一番右の大きなサークルが現在のもの。過去のものも状態変化の経緯を示すために表示。色(初期値: 緑)や表示(初期値: 表示)の指定。

Advanced Divergence IndicatorAdvanced Divergence Indicator
Unlock the full potential of your trading strategy with the Advanced Divergence Indicator, a powerful tool designed to identify and analyze bullish and bearish divergences using multiple technical indicators. Whether you're a seasoned trader or just starting out, this indicator provides clear, actionable signals to help you make informed trading decisions.
What It Does
The Advanced Divergence Indicator detects divergences between price movements and key technical indicators, specifically the Relative Strength Index (RSI) and On-Balance Volume (OBV). Divergence occurs when the price trends in one direction while the indicator trends in the opposite direction, signaling potential reversals or continuations in the market.
Key Features
Multi-Indicator Analysis
RSI Divergence: Identifies bullish and bearish divergences using the RSI, helping you spot potential reversals based on momentum.
OBV Divergence: Utilizes OBV to detect divergences related to volume flow, providing insights into the strength behind price movements.
Bullish and Bearish Signals
Bullish Divergence: Signals when indicators show higher lows while the price forms lower lows, suggesting a potential upward reversal.
Bearish Divergence: Alerts when indicators display lower highs while the price creates higher highs, indicating a possible downward reversal.
Signal Strength Classification
Standard Signals: Represent typical divergence occurrences, marked with green (bullish) and red (bearish) labels.
Strong Signals: Highlighted with yellow (strong bullish) and blue (strong bearish) labels when divergences coincide with overbought or oversold conditions, enhancing signal reliability.
Customizable Settings
Indicator Selection: Choose to enable RSI, OBV, or both based on your trading preferences.
Pivot Points: Adjust the number of bars left and right to fine-tune pivot detection for more accurate divergence identification.
Range Configuration: Set minimum and maximum bar ranges to control the sensitivity of divergence detection, suitable for different timeframes and trading styles.
Noise Cancellation: Reduce false signals by enabling noise filtering, ensuring that only significant divergences are highlighted.
Visual Clarity
Color-Coded Labels: Easily distinguish between different types of divergences with intuitive color codes—green for bullish, red for bearish, yellow for strong bullish, and blue for strong bearish signals.
Clean Chart Display: The indicator overlays seamlessly on your chart without clutter, ensuring that signals are easily identifiable without distracting from price action.
Real-Time Alerts
Custom Alert Conditions: Receive instant notifications for bullish and bearish divergences, enabling you to act promptly on potential trading opportunities.
Combined Alerts: Get alerts for either bullish or bearish signals, or both, based on your selected criteria.
How to Use
Add the Indicator to Your Chart
Apply the Advanced Divergence Indicator to your desired chart and timeframe.
Configure Settings
Select Indicators: Choose to enable RSI, OBV, or both under the "Indicator Settings" group.
Adjust Parameters: Customize RSI length, pivot points, and divergence ranges to match your trading strategy and the specific asset you are analyzing.
Enable Noise Cancellation: Activate this feature to filter out minor divergences and focus on more significant signals.
Interpret the Signals
Bullish Signals: Look for green or yellow labels below the price bars indicating potential upward reversals.
Bearish Signals: Identify red or blue labels above the price bars signaling possible downward reversals.
Strong Signals: Pay special attention to yellow and blue labels as they denote stronger divergences with higher reliability.
Set Up Alerts
Configure alert conditions within the indicator to receive real-time notifications when bullish or bearish divergences are detected, ensuring you never miss a trading opportunity.
Why Choose Advanced Divergence Indicator
Comprehensive Analysis : By combining RSI and OBV, the indicator provides a more robust analysis compared to single-indicator tools, enhancing the accuracy of divergence detection.
Flexibility : Highly customizable settings allow traders to tailor the indicator to their unique strategies and market conditions.
User-Friendly : Clear labels and color codes make it easy for traders of all levels to understand and act on the signals.
Reliability : Strong signal classification and noise cancellation features help reduce false positives, providing more trustworthy trading signals.

Swing High/Low Pivots Strategy [LV]The Swing High/Low Pivots Strategy was developed as a counter-momentum trading tool.
The strategy is suitable for any market and the default values used in the input settings menu are set for Bitcoin (best on 15min). These values, expressed in minimum ticks (or pips if symbol is Forex) make this tool perfectly adaptable to every symbol and/or timeframe.
Check tooltips in the settings menu for more details about every user input.
STRTEGY ENTRY & EXIT MECHANISMS:
Trades Entry based on the detection of swing highs and lows for short and long entries respectively, validated by:
- Limit orders placed after each new pivot level confirmation
- Moving averages trend filter (if enabled)
- No active trade currently open
Trades Exit when the price reaches take-profit or stop-loss level as defined in the settings menu. A double entry/second take-profit level can be enabled for partial exits, with dynamic stop-loss adjustment for the remaining position.
Enhanced Trade Precision:
By limiting entries to confirmed swing high (HH, LH) or swing low (HL, LL) pivot points, the strategy ensures that trades occur at levels of significant price reversals. This precision reduces the likelihood of entering trades in the midst of a trend or during uncertain price action.
Risk Management Optimization:
The strategy incorporates clearly defined stop-loss (SL) and take-profit (TP) levels derived from the pivot points. This structured approach minimizes potential losses while locking in profits, which is critical for consistent performance in volatile markets.
Trend Filtering for Better Entry:
The use of a configurable moving average filter adds a layer of trend validation. This prevents entering trades against the dominant market trend, increasing the probability of success for each trade.
Avoidance of Noise:
The lookback period (length parameter) confirms pivots only after a set number of bars, effectively filtering out market noise and ensuring that entries are based on reliable, well-defined price movements.
Adaptability Across Markets:
The strategy is versatile and can be applied across different markets (Forex, stocks, crypto) due to its dynamic use of ticks and pips converters. It adapts seamlessly to varying price scales and asset types.
Dual Quantity Entries:
The original and optionnal double-entry mechanism allows traders to capture both short-term and extended profits by scaling out of positions. This adaptive approach caters to varying risk appetites and market conditions.
Clear Visualization:
The plotted pivot points, entry limits, SL, and TP levels provide visual clarity, making it easy for traders to track the strategy's behavior and make informed decisions.
Automated Execution with Alerts:
Integrated alerts for both entries and exits ensure timely actions without the need for constant market monitoring, enhancing efficiency. Configurable alert messages are suitable for API use.
Any feedback, comments, or suggestions for improvement are always welcome.
Hope you enjoy!

ICT Setup 02 [TradingFinder] Breaker Blocks + Reversal Candles🔵 Introduction
The "Breaker Block" concept, widely utilized in ICT (Inner Circle Trader) technical analysis, is a crucial tool for identifying reversal points and significant market shifts. Originating from the "Order Block" concept, Breaker Blocks help traders pinpoint support and resistance levels. These blocks are essential for understanding market trends and recognizing optimal entry and exit points.
A Breaker Block is essentially a failed Order Block that changes its role when price action breaks through it. When an Order Block fails to hold as a support or resistance level, it reverses its function, becoming a Breaker Block.
There are two primary types : Bullish Breaker Blocks and Bearish Breaker Blocks. These Breaker Blocks align with the prevailing market trend and indicate potential entry points after a liquidity sweep or a shift in market structure.
Understanding and applying the Breaker Block strategy enables traders to capitalize on the behavior of institutional investors, enhancing their trading outcomes.
Bullish Setup :
Bearish Setup :
🔵 How to Use
The ICT Setup 02 indicator designed to automate the identification of Bullish and Bearish Breaker Blocks. This tool enables traders to easily spot these blocks on a chart and utilize them for entering or exiting trades. Below is a breakdown of how to use this indicator in both bullish and bearish setups.
🟣 Bullish Breaker Block Setup
A Bullish Breaker Block setup is identified in an uptrend, where it serves as a potential entry point. This setup occurs when a Bearish Order Block fails and the price moves above the high of that Order Block. In this scenario, the previously bearish Order Block turns into a Bullish Breaker Block, which now acts as a support level for the price.
To trade a Bullish Breaker Block, wait for the price to retest this newly formed support level. Confirmation of the uptrend can be achieved by analyzing lower time frames for further market structure shifts or other bullish indicators.
A successful retest of the Bullish Breaker Block provides a high-probability entry point for a long trade, as it signals institutional support. Traders often place their stop-loss below the low of the Breaker Block zone to minimize risk.
🟣 Bearish Breaker Block Setup
A Bearish Breaker Block setup, conversely, is used in a downtrend to identify potential sell opportunities. This setup forms when a Bullish Order Block fails, and the price moves below the low of that Order Block.
Once this Order Block is broken, it reverses its role and becomes a Bearish Breaker Block, providing resistance to the price as it pushes downward. For a Bearish Breaker Block trade, wait for the price to retest this resistance level.
A confirmation of the downtrend, such as a market structure shift on a lower time frame or additional bearish signals, strengthens the setup. The Bearish Breaker Block retest provides an opportunity to enter a short position, with a stop-loss placed just above the high of the Breaker Block zone.
🔵 Settings
Pivot Period : This setting controls the look-back period used to identify pivot points that contribute to the detection of Order Blocks. A higher period captures longer-term pivots, while a lower period focuses on more recent price action. Adjusting this parameter allows traders to fine-tune the indicator to match their trading time frame.
Breaker Block Validity Period : This setting defines how long a Breaker Block remains valid based on the number of bars elapsed since its formation. Increasing the validity period keeps Breaker Blocks active for a longer duration, which can be useful for higher time frame analysis.
Mitigation Level BB : This option lets traders choose the level of the Order Block at which the price is expected to react. Options like "Proximal," "50% OB," and "Distal" adjust the zone where a reaction may occur, offering flexibility in setting up the entry and stop-loss levels.
Breaker Block Refinement : The refinement option refines the Breaker Block zone to display a more precise range for aggressive or defensive trading approaches. The "Aggressive" mode provides a tighter range for risk-tolerant traders, while the "Defensive" mode expands the zone for those with a more conservative approach.
🔵 Conclusion
The Breaker Block indicator provides traders with a sophisticated tool for identifying key reversal zones in the market. By leveraging Breaker Blocks, traders can gain insights into institutional order flow and predict critical support and resistance levels.
Using Breaker Blocks in conjunction with other ICT concepts, like Fair Value Gaps or liquidity sweeps, enhances the reliability of trading signals. This indicator empowers traders to make informed decisions, aligning their trades with institutional moves in the market.
As with any trading strategy, it is crucial to incorporate proper risk management, using stop-losses and position sizing to minimize potential losses. The Breaker Block strategy, when applied with discipline and thorough analysis, serves as a powerful addition to any trader’s toolkit.

Ultimate ZonesThe story is simple: I didn't find a support/resistance zones indicator that I actually liked, so I made my own.
Features:
Independent of the chart timeframe (zones don't change if you switch timeframes) - very important for practical use
Live mode (repainting) plus historic mode (non-repainting)
Selectable timeframe for zone calculation (default: daily)
Can adjust how far the indicator looks back into the past (default: 500 days)
Can adjust pivot period to find more or fewer zones
Zone heights are based on long-term ATR (to adapt to the asset's volatility automatically)
Price tolerance multiplier is adjustable
Option to merge zones which are close together into one ("fat zones")
I find that together these options (especially those in the "sensitivity" section) allow me to automatically generate almost all the zones I want to see. Occasionally, I do draw some additional zones to get the perfect image I'm looking for on the chart.
Explanation
We detect pivot points on the selected zone timeframe (taking pivot period and lookback limit into account). Then we combine these pivot points into a zone if they are close enough together in price (here the tolerance parameter comes into play). If "fat zones" is selected, we perform these merges more aggressively even if the resulting zone becomes taller than the standard tolerance.
The ATR used for the tolerance is a 500 period ATR, but if there are less than 500 bars available, we use the average of the bars available so far, so we always have a value to work with.
In order for a zone to be displayed, it must have been touched by at least 2 separate pivot points. We do not distinguish between pivot highs and pivot lows because support is known to turn into resistance and vice versa.
In live mode, we draw the currently active zones as boxes.
In historic mode, we plot the active zones at each bar using "plot" and "fill", so there is no repainting or erasing, and you can see which zones were active at any past date. For practical reasons, we draw a maximum of 15 zones around the current price (i.e. 7-8 zones above and 7-8 zones below the price).

Enhanced BOS Strategy with SL/TP and EMA TableDescription:
The Enhanced BOS (Break of Structure) Strategy is an advanced open-source trading indicator designed to identify key market structure changes, integrated with dynamic Stop Loss (SL) and Take Profit (TP) levels, along with an informative EMA (Exponential Moving Average) table for added trend analysis.
Key Features:
Break of Structure (BOS) Detection:
The script detects bullish and bearish BOS by identifying pivot points using a custom pivot period. When the price crosses above or below these points, it signals a potential market trend reversal or continuation.
Dynamic SL/TP Levels:
Users can toggle static SL/TP settings, which automatically calculate levels based on user-defined points. These levels are visualized on the chart with dotted lines and labeled for clarity.
Volume Filters:
The strategy includes a volume condition filter to ensure that only trades within a specified volume range are considered. This helps in avoiding low-volume trades that might lead to false signals.
EMA Table Display:
An on-chart table displaying the current values of the 13-period, 50-period, and 200-period EMAs. This provides a quick reference for trend identification and confirmation, helping traders to stay aligned with the broader market trend.
How It Works:
The script utilizes a combination of moving averages and pivot points to identify potential breakouts or breakdowns in market structure. When a bullish BOS is detected, and the volume conditions are met, the strategy suggests a long position, marking potential SL/TP levels. Similarly, it suggests short positions for bearish BOS.
The EMA table serves as a visual aid, providing real-time updates of the EMA values, allowing traders to gauge the market’s directional bias quickly.
How to Use:
Setting Parameters:
Adjust the pivot period to fine-tune BOS detection according to your trading style and the asset’s volatility.
Configure the SL/TP settings based on your risk tolerance and target profit levels.
Interpreting Signals:
A “Buy” label on the chart indicates a bullish BOS with volume confirmation, signaling a potential long entry.
A “Sell” label indicates a bearish BOS with volume confirmation, signaling a potential short entry.
The EMA table aids in confirming these signals, where the position of the fast, mid, and slow EMAs can provide additional context to the trend’s strength and direction.
Volume Filtering:
Ensure your trades are filtered through the script’s volume condition, which allows for the exclusion of low-volume periods that might generate unreliable signals.
Unique Value:
Unlike many other BOS strategies, this script integrates volume conditions and a visual EMA table, providing a comprehensive toolkit for traders looking to capture market structure shifts while maintaining an eye on trend direction and trade execution precision.
Additional Information:
This script is designed for use on standard bar or candlestick charts for best results.
It is open-source and free to use, encouraging collaboration and improvement by the TradingView community.
By combining powerful trend-following EMAs with the precision of BOS detection and the safety of volume filtering, the Enhanced BOS Strategy offers a balanced approach to trading market structure changes.

WaveTrend With Divs & RSI(STOCH) Divs by WeloTradesWaveTrend with Divergences & RSI(STOCH) Divergences by WeloTrades
Overview
The "WaveTrend With Divergences & RSI(STOCH) Divergences" is an advanced Pine Script™ indicator designed for TradingView, offering a multi-dimensional analysis of market conditions. This script integrates several technical indicators—WaveTrend, Money Flow Index (MFI), RSI, and Stochastic RSI—into a cohesive tool that identifies both regular and hidden divergences across these indicators. These divergences can indicate potential market reversals and provide critical trading opportunities.
This indicator is not just a simple combination of popular tools; it offers extensive customization options, organized data presentation, and valuable trading signals that are easy to interpret. Whether you're a day trader or a long-term investor, this script enhances your ability to make informed decisions.
Originality and Usefulness
The originality of this script lies in its integration and the synergy it creates among the indicators used. Rather than merely combining multiple indicators, this script allows them to work together, enhancing each other's strengths. For example, by identifying divergences across WaveTrend, RSI, and Stochastic RSI simultaneously, the script provides multiple layers of confirmation, which reduces the likelihood of false signals and increases the reliability of trading signals.
The usefulness of this script is apparent in its ability to offer a consolidated view of market dynamics. It not only simplifies the analytical process by combining different indicators but also provides deeper insights through its divergence detection features. This comprehensive approach is designed to help traders identify potential market reversals, confirm trends, and ultimately make more informed trading decisions.
How the Components Work Together
1. Cross-Validation of Signals
WaveTrend: This indicator is primarily used to identify overbought and oversold conditions, as well as potential buy and sell signals. WaveTrend's ability to smooth price data and reduce noise makes it a reliable tool for identifying trend reversals.
RSI & Stochastic RSI: These momentum oscillators are used to measure the speed and change of price movements. While RSI identifies general overbought and oversold conditions, Stochastic RSI offers a more granular view by tracking the RSI’s level relative to its high-low range over a period of time. When these indicators align with WaveTrend signals, it adds a layer of confirmation that enhances the reliability of the signals.
Money Flow Index (MFI): This volume-weighted indicator assesses the inflow and outflow of money in an asset, giving insights into buying and selling pressure. By analyzing the MFI alongside WaveTrend and RSI indicators, the script can cross-validate signals, ensuring that buy or sell signals are supported by actual market volume.
Example Bullish scenario:
When a bullish divergence is detected on the RSI and confirmed by a corresponding bullish signal on the WaveTrend, along with an increasing Money Flow Index, the probability of a successful trade setup increases. This cross-validation minimizes the risk of acting on false signals, which might occur when relying on a single indicator.
Example Bearish scenario:
When a bearish divergence is detected on the RSI and confirmed by a corresponding bearish signal on the WaveTrend, along with an decreasing Money Flow Index, the probability of a successful trade setup increases. This cross-validation minimizes the risk of acting on false signals, which might occur when relying on a single indicator.
2. Divergence Detection and Market Reversals
Regular Divergences: Occur when the price action and an indicator (like RSI or WaveTrend) move in opposite directions. Regular bullish divergence signals a potential upward reversal when the price makes a lower low while the indicator makes a higher low. Conversely, regular bearish divergence suggests a downward reversal when the price makes a higher high, but the indicator makes a lower high.
Hidden Divergences: These occur when the price action and indicator move in the same direction, but with different momentum. Hidden bullish divergence suggests the continuation of an uptrend, while hidden bearish divergence suggests the continuation of a downtrend. By detecting these divergences across multiple indicators, the script identifies potential trend reversals or continuations with greater accuracy.
Example: The script might detect a regular bullish divergence on the WaveTrend while simultaneously identifying a hidden bullish divergence on the RSI. This combination suggests that while a trend reversal is possible, the overall market sentiment remains bullish, providing a nuanced view of the market.
A Regular Bullish Divergence Example:
A Hidden Bullish Divergence Example:
A Regular Bearish Divergence Example:
A Hidden Bearish Divergence Example:
3. Trend Strength and Sentiment Analysis
WaveTrend: Measures the strength and direction of the trend. By identifying the extremes of market sentiment (overbought and oversold levels), WaveTrend provides early signals for potential reversals.
Money Flow Index (MFI): Assesses the underlying sentiment by analyzing the flow of money. A rising MFI during an uptrend confirms strong buying pressure, while a falling MFI during a downtrend confirms selling pressure. This helps traders assess whether a trend is likely to continue or reverse.
RSI & Stochastic RSI: Offer a momentum-based perspective on the trend’s strength. High RSI or Stochastic RSI values indicate that the asset may be overbought, suggesting a potential reversal. Conversely, low values indicate oversold conditions, signaling a possible upward reversal.
Example:
During a strong uptrend, the WaveTrend & RSI's might signal overbought conditions, suggesting caution. If the MFI also shows decreasing buying pressure and the RSI reaches extreme levels, these indicators together suggest that the trend might be weakening, and a reversal could be imminent.
Example:
During a strong downtrend, the WaveTrend & RSI's might signal oversold conditions, suggesting caution. If the MFI also shows increasing buying pressure and the RSI reaches extreme levels, these indicators together suggest that the trend might be weakening, and a reversal could be imminent.
Conclusion
The "WaveTrend With Divergences & RSI(STOCH) Divergences" script offers a powerful, integrated approach to technical analysis by combining trend, momentum, and sentiment indicators into a single tool. Its unique value lies in the cross-validation of signals, the ability to detect divergences, and the comprehensive view it provides of market conditions. By offering traders multiple layers of analysis and customization options, this script is designed to enhance trading decisions, reduce false signals, and provide clearer insights into market dynamics.
WAVETREND
Display of WaveTrend:
Display of WaveTrend Setting:
WaveTrend Indicator Explanation
The WaveTrend indicator helps identify overbought and oversold conditions, as well as potential buy and sell signals. Its flexibility allows traders to adapt it to various strategies, making it a versatile tool in technical analysis.
WaveTrend Input Settings:
WT MA Source: Default: HLC3
What it is: The data source used for calculating the WaveTrend Moving Average.
What it does: Determines the input data to smooth price action and filter noise.
Example: Using HLC3 (average of High, Low, Close) provides a smoother data representation compared to using just the closing price.
Length (WT MA Length): Default: 3
What it is: The period used to calculate the Moving Average.
What it does: Adjusts the sensitivity of the WaveTrend indicator, where shorter lengths respond more quickly to price changes.
Example: A length of 3 is ideal for short-term analysis, providing quick reactions to price movements.
WT Channel Length & Average: Default: WT Channel Length = 9, Average = 12
What it is: Lengths used to calculate the WaveTrend channel and its average.
What it does: Smooths out the WaveTrend further, reducing false signals by averaging over a set period.
Example: Higher values reduce noise and help in identifying more reliable trends.
Channel: Style, Width, and Color:
What it is: Customization options for the WaveTrend channel's appearance.
What it does: Adjusts how the channel is displayed, including line style, width, and color.
Example: Choosing an area style with a distinct color can make the WaveTrend indicator clearly visible on the chart.
WT Buy & Sell Signals:
What it is: Settings to enable and customize buy and sell signals based on WaveTrend.
What it does: Allows for the display of buy/sell signals and customization of their shapes and colors.
When it gives a Buy Signal: Generated when the WaveTrend line crosses below an oversold level and then rises back, indicating a potential upward price movement.
When it gives a Sell Signal: Triggered when the WaveTrend line crosses above an overbought level and then declines, suggesting a possible downward trend.
Example: The script identifies these signals based on mean reversion principles, where prices tend to revert to the mean after reaching extremes. Traders can use these signals to time their entries and exits effectively.
WAVETREND OVERBOUGTH AND OVERSOLD LEVELS
Display of WaveTrend with Overbought & Oversold Levels:
Display of WaveTrend Overbought & Oversold Levels Settings:
WaveTrend Overbought & Oversold Levels Explanation
WT OB & OS Levels: Default: OB Level 1 = 53, OB Level 2 = 60, OS Level 1 = -53, OS Level 2 = -60
What it is: The default overbought and oversold levels used by the WaveTrend indicator to signal potential market reversals.
What it does: When the WaveTrend crosses above the OB levels, it indicates an overbought condition, potentially signaling a reversal or selling opportunity. Conversely, when it crosses below the OS levels, it indicates an oversold condition, potentially signaling a reversal or buying opportunity.
Example: A trader might use these levels to time entry or exit points, such as selling when the WaveTrend crosses into the overbought zone or buying when it crosses into the oversold zone.
Show OB/OS Levels: Default: True
What it is: Toggle options to show or hide the overbought and oversold levels on your chart.
What it does: When enabled, these levels will be visually represented on your chart, helping you to easily identify when the market reaches these critical thresholds.
Example: Displaying these levels can help you quickly see when the WaveTrend is approaching or has crossed into overbought or oversold territory, allowing for more informed trading decisions.
Line Style, Width, and Color for OB/OS Levels:
What it is: Options to customize the appearance of the OB and OS levels on your chart, including line style (solid, dotted, dashed), line width, and color.
What it does: These settings allow you to adjust how prominently these levels are displayed on your chart, which can help you better visualize and respond to overbought or oversold conditions.
Example: Setting a thicker, dashed line in a contrasting color can make these levels stand out more clearly, aiding in quick visual identification.
Example of Use:
Scenario: A trader wants to identify potential selling points when the market is overbought. They set the OB levels at 53 and 60, choosing a solid, red line style to make these levels clear on their chart. As the WaveTrend crosses above 53, they monitor for further price action, and upon crossing 60, they consider initiating a sell order.
WAVETREND DIVERGENCES
Display of WaveTrend Divergence:
Display of WaveTrend Divergence Setting:
WaveTrend Divergence Indicator Explanation
The WaveTrend Divergence feature helps identify potential reversal points in the market by highlighting divergences between the price and the WaveTrend indicator. Divergences can signal a shift in market momentum, indicating a possible trend reversal. This component allows traders to visualize and customize divergence detection on their charts.
WaveTrend Divergence Input Settings:
Potential Reversal Range: Default: 28
What it is: The number of bars to look back when detecting potential tops and bottoms.
What it does: Sets the range for identifying possible reversal points based on historical data.
Example: A setting of 28 looks back across the last 28 bars to find reversal points, offering a balance between responsiveness and reliability.
Reversal Minimum LVL OB & OS: Default: OB = 35, OS = -35
What it is: The minimum overbought and oversold levels required for detecting potential reversals.
What it does: Adjusts the thresholds that trigger a reversal signal based on the WaveTrend indicator.
Example: A higher OB level reduces the sensitivity to overbought conditions, potentially filtering out false reversal signals.
Lookback Bar Left & Right: Default: Left = 10, Right = 1
What it is: The number of bars to the left and right used to confirm a top or bottom.
What it does: Helps determine the position of peaks and troughs in the price action.
Example: A larger left lookback captures more extended price action before the peak, while a smaller right lookback focuses on the immediate past.
Lookback Range Min & Max: Default: Min = 5, Max = 60
What it is: The minimum and maximum range for the lookback period when identifying divergences.
What it does: Fine-tunes the detection of divergences by controlling the range over which the indicator looks back.
Example: A wider range increases the chances of detecting divergences across different market conditions.
R.Div Minimum LVL OB & OS: Default: OB = 53, OS = -53
What it is: The threshold levels for detecting regular divergences.
What it does: Adjusts the sensitivity of the regular divergence detection.
Example: Higher thresholds make the detection more conservative, identifying only stronger divergence signals.
H.Div Minimum LVL OB & OS: Default: OB = 20, OS = -20
What it is: The threshold levels for detecting hidden divergences.
What it does: Similar to regular divergence settings but for hidden divergences, which can indicate potential reversals that are less obvious.
Example: Lower thresholds make the hidden divergence detection more sensitive, capturing subtler market shifts.
Divergence Label Options:
What it is: Options to display and customize labels for regular and hidden divergences.
What it does: Allows users to visually differentiate between regular and hidden divergences using customizable labels and colors.
Example: Using different colors and symbols for regular (R) and hidden (H) divergences makes it easier to interpret signals on the chart.
Text Size and Color:
What it is: Customization options for the size and color of divergence labels.
What it does: Adjusts the readability and visibility of divergence labels on the chart.
Example: Larger text size may be preferred for charts with a lot of data, ensuring divergence labels stand out clearly.
FAST & SLOW MONEY FLOW INDEX
Display of Fast & Slow Money Flow:
Display of Fast & Slow Money Flow Setting:
Fast Money Flow Indicator Explanation
The Fast Money Flow indicator helps traders identify the flow of money into and out of an asset over a shorter time frame. By tracking the volume-weighted average of price movements, it provides insights into buying and selling pressure in the market, which can be crucial for making timely trading decisions.
Fast Money Flow Input Settings:
Fast Money Flow: Length: Default: 9
What it is: The period used for calculating the Fast Money Flow.
What it does: Determines the sensitivity of the Money Flow calculation. A shorter length makes the indicator more responsive to recent price changes, while a longer length provides a smoother signal.
Example: A length of 9 is suitable for traders looking to capture quick shifts in market sentiment over a short period.
Fast MFI Area Multiplier: Default: 5
What it is: A multiplier applied to the Money Flow area calculation.
What it does: Adjusts the size of the Money Flow area on the chart, effectively amplifying or reducing the visual impact of the indicator.
Example: A higher multiplier can make the Money Flow more prominent on the chart, aiding in the quick identification of significant money flow changes.
Y Position (Y Pos): Default: 0
What it is: The vertical position adjustment for the Fast Money Flow plot on the chart.
What it does: Allows you to move the Money Flow plot up or down on the chart to avoid overlap with other indicators.
Example: Adjusting the Y Position can be useful if you have multiple indicators on the chart and need to maintain clarity.
Fast MFI Style, Width, and Color:
What it is: Customization options for how the Fast Money Flow is displayed on the chart.
What it does: Enables you to choose between different plot styles (line or area), set the line width, and select colors for positive and negative money flow.
Example: Using different colors for positive (green) and negative (red) money flow helps to visually distinguish between periods of buying and selling pressure.
Slow Money Flow Indicator Explanation
The Slow Money Flow indicator tracks the flow of money into and out of an asset over a longer time frame. It provides a broader perspective on market sentiment, smoothing out short-term fluctuations and highlighting longer-term trends.
Slow Money Flow Input Settings:
Slow Money Flow: Length: Default: 12
What it is: The period used for calculating the Slow Money Flow.
What it does: A longer period smooths out short-term fluctuations, providing a clearer view of the overall money flow trend.
Example: A length of 12 is often used by traders looking to identify sustained trends rather than short-term volatility.
Slow MFI Area Multiplier: Default: 5
What it is: A multiplier applied to the Slow Money Flow area calculation.
What it does: Adjusts the size of the Money Flow area on the chart, helping to emphasize the indicator’s significance.
Example: Increasing the multiplier can help highlight the Money Flow in markets with less volatile price action.
Y Position (Y Pos): Default: 0
What it is: The vertical position adjustment for the Slow Money Flow plot on the chart.
What it does: Allows for vertical repositioning of the Money Flow plot to maintain chart clarity when used with other indicators.
Example: Adjusting the Y Position ensures that the Slow Money Flow indicator does not overlap with other key indicators on the chart.
Slow MFI Style, Width, and Color:
What it is: Customization options for the visual display of the Slow Money Flow on the chart.
What it does: Allows you to choose the plot style (line or area), set the line width, and select colors to differentiate positive and negative money flow.
Example: Customizing the colors for the Slow Money Flow allows traders to quickly distinguish between buying and selling trends in the market.
RSI
Display of RSI:
Display of RSI Setting:
RSI Indicator Explanation
The Relative Strength Index (RSI) is a momentum oscillator that measures the speed and change of price movements. It is typically used to identify overbought or oversold conditions in the market, providing traders with potential signals for buying or selling.
RSI Input Settings:
RSI Source: Default: Close
What it is: The data source used for calculating the RSI.
What it does: Determines which price data (e.g., close, open) is used in the RSI calculation, affecting how the indicator reflects market conditions.
Example: Using the closing price is standard practice, as it reflects the final agreed-upon price for a given time period.
MA Type (Moving Average Type): Default: SMA
What it is: The type of moving average applied to the RSI for smoothing purposes.
What it does: Changes the smoothing technique of the RSI, impacting how quickly the indicator responds to price movements.
Example: Using an Exponential Moving Average (EMA) will make the RSI more sensitive to recent price changes compared to a Simple Moving Average (SMA).
RSI Length: Default: 14
What it is: The period over which the RSI is calculated.
What it does: Adjusts the sensitivity of the RSI. A shorter length (e.g., 7) makes the RSI more responsive to recent price changes, while a longer length (e.g., 21) smooths out the indicator, reducing the number of signals.
Example: A 14-period RSI is commonly used for identifying overbought and oversold conditions, providing a balance between sensitivity and reliability.
RSI Plot Style, Width, and Color:
What it is: Options to customize the appearance of the RSI line on the chart.
What it does: Allows you to adjust the visual representation of the RSI, including the line width and color.
Example: Setting a thicker line width and a bright color like yellow can make the RSI more visible on the chart, aiding in quick analysis.
Display of RSI with RSI Moving Average:
RSI Moving Average Explanation
The RSI Moving Average adds a smoothing layer to the RSI, helping to filter out noise and provide clearer signals. It is particularly useful for confirming trend strength and identifying potential reversals.
RSI Moving Average Input Settings:
MA Length: Default: 14
What it is: The period over which the Moving Average is calculated on the RSI.
What it does: Adjusts the smoothing of the RSI, helping to reduce false signals and provide a clearer trend indication.
Example: A 14-period moving average on the RSI can smooth out short-term fluctuations, making it easier to spot genuine overbought or oversold conditions.
MA Plot Style, Width, and Color:
What it is: Customization options for how the RSI Moving Average is displayed on the chart.
What it does: Allows you to adjust the line width and color, helping to differentiate the Moving Average from the main RSI line.
Example: Using a contrasting color for the RSI Moving Average (e.g., magenta) can help it stand out against the main RSI line, making it easier to interpret the indicator.
STOCHASTIC RSI
Display of Stochastic RSI:
Display of Stochastic RSI Setting:
Stochastic RSI Indicator Explanation
The Stochastic RSI (Stoch RSI) is a momentum oscillator that measures the level of the RSI relative to its high-low range over a set period of time. It is used to identify overbought and oversold conditions, providing potential buy and sell signals based on momentum shifts.
Stochastic RSI Input Settings:
Stochastic RSI Length: Default: 14
What it is: The period over which the Stochastic RSI is calculated.
What it does: Adjusts the sensitivity of the Stochastic RSI. A shorter length makes the indicator more responsive to recent price changes, while a longer length smooths out the fluctuations, reducing noise.
Example: A length of 14 is commonly used to identify momentum shifts over a medium-term period, providing a balanced view of potential overbought or oversold conditions.
Display of Stochastic RSI %K Line:
Stochastic RSI %K Line Explanation
The %K line in the Stochastic RSI is the main line that tracks the momentum of the RSI over the chosen period. It is the faster-moving component of the Stochastic RSI, often used to identify entry and exit points.
Stochastic RSI %K Input Settings:
%K Length: Default: 3
What it is: The period used for smoothing the %K line of the Stochastic RSI.
What it does: Smoothing the %K line helps reduce noise and provides a clearer signal for potential market reversals.
Example: A smoothing length of 3 is common, offering a balance between responsiveness and noise reduction, making it easier to spot significant momentum shifts.
%K Plot Style, Width, and Color:
What it is: Customization options for the visual representation of the %K line.
What it does: Allows you to adjust the appearance of the %K line on the chart, including line width and color, to fit your visual preferences.
Example: Setting a blue color and a medium width for the %K line makes it stand out clearly on the chart, helping to identify key points of momentum change.
%K Fill Color (Above):
What it is: The fill color that appears above the %K line on the chart.
What it does: Adds visual clarity by shading the area above the %K line, making it easier to interpret the direction and strength of momentum.
Example: Using a light blue fill color above the %K line can help emphasize bullish momentum, making it visually prominent.
Display of Stochastic RSI %D Line:
Stochastic RSI %D Line Explanation
The %D line in the Stochastic RSI is a moving average of the %K line and acts as a signal line. It is slower-moving compared to the %K line and is often used to confirm signals or identify potential reversals when it crosses the %K line.
Stochastic RSI %D Input Settings:
%D Length: Default: 3
What it is: The period used for smoothing the %D line of the Stochastic RSI.
What it does: Smooths out the %D line, making it less sensitive to short-term fluctuations and more reliable for identifying significant market signals.
Example: A length of 3 is often used to provide a smoothed signal line that can help confirm trends or reversals indicated by the %K line.
%D Plot Style, Width, and Color:
What it is: Customization options for the visual representation of the %D line.
What it does: Allows you to adjust the appearance of the %D line on the chart, including line width and color, to match your preferences.
Example: Setting an orange color and a thicker line width for the %D line can help differentiate it from the %K line, making crossover points easier to spot.
%D Fill Color (Below):
What it is: The fill color that appears below the %D line on the chart.
What it does: Adds visual clarity by shading the area below the %D line, making it easier to interpret bearish momentum.
Example: Using a light orange fill color below the %D line can highlight bearish conditions, making it visually easier to identify.
RSI & STOCHASTIC RSI OVERBOUGHT AND OVERSOLD LEVELS
Display of RSI & Stochastic with Overbought & Oversold Levels:
Display of RSI & Stochastic Overbought & Oversold Settings:
RSI & Stochastic Overbought & Oversold Levels Explanation
The Overbought (OB) and Oversold (OS) levels for RSI and Stochastic RSI indicators are key thresholds that help traders identify potential reversal points in the market. These levels are used to determine when an asset is likely overbought or oversold, which can signal a potential trend reversal.
RSI & Stochastic Overbought & Oversold Input Settings:
RSI & Stochastic Level 1 Overbought (OB) & Oversold (OS): Default: OB Level = 170, OS Level = 130
What it is: The first set of thresholds for determining overbought and oversold conditions for both RSI and Stochastic RSI indicators.
What it does: When the RSI or Stochastic RSI crosses above the overbought level, it suggests that the asset might be overbought, potentially signaling a sell opportunity. Conversely, when these indicators drop below the oversold level, it suggests the asset might be oversold, potentially signaling a buy opportunity.
Example: If the RSI crosses above 170, traders might look for signs of a potential trend reversal to the downside, while a cross below 130 might indicate a reversal to the upside.
RSI & Stochastic Level 2 Overbought (OB) & Oversold (OS): Default: OB Level = 180, OS Level = 120
What it is: The second set of thresholds for determining overbought and oversold conditions for both RSI and Stochastic RSI indicators.
What it does: These levels provide an additional set of reference points, allowing traders to differentiate between varying degrees of overbought and oversold conditions, potentially leading to more refined trading decisions.
Example: When the RSI crosses above 180, it might indicate an extreme overbought condition, which could be a stronger signal for a sell, while a cross below 120 might indicate an extreme oversold condition, which could be a stronger signal for a buy.
RSI & Stochastic Overbought (OB) Band Customization:
OB Level 1: Width, Style, and Color:
What it is: Customization options for the visual appearance of the first overbought band on the chart.
What it does: Allows you to set the line width, style (solid, dotted, dashed), and color for the first overbought band, enhancing its visibility on the chart.
Example: A dashed red line with medium width can clearly indicate the first overbought level, helping traders quickly identify when this threshold is crossed.
OB Level 2: Width, Style, and Color:
What it is: Customization options for the visual appearance of the second overbought band on the chart.
What it does: Allows you to set the line width, style, and color for the second overbought band, providing a clear distinction from the first band.
Example: A dashed red line with a slightly thicker width can represent a more significant overbought level, making it easier to differentiate from the first level.
RSI & Stochastic Oversold (OS) Band Customization:
OS Level 1: Width, Style, and Color:
What it is: Customization options for the visual appearance of the first oversold band on the chart.
What it does: Allows you to set the line width, style (solid, dotted, dashed), and color for the first oversold band, making it visually prominent.
Example: A dashed green line with medium width can highlight the first oversold level, helping traders identify potential buying opportunities.
OS Level 2: Width, Style, and Color:
What it is: Customization options for the visual appearance of the second oversold band on the chart.
What it does: Allows you to set the line width, style, and color for the second oversold band, providing an additional visual cue for extreme oversold conditions.
Example: A dashed green line with a thicker width can represent a more significant oversold level, offering a stronger visual cue for potential buying opportunities.
RSI DIVERGENCES
Display of RSI Divergence Labels:
Display of RSI Divergence Settings:
RSI Divergence Lookback Explanation
The RSI Divergence settings allow traders to customize the parameters for detecting divergences between the RSI (Relative Strength Index) and price action. Divergences occur when the price moves in the opposite direction to the RSI, potentially signaling a trend reversal. These settings help refine the accuracy of divergence detection by adjusting the lookback period and range. ( NOTE: This setting only imply to the RSI. This doesn't effect the STOCHASTIC RSI. )
RSI Divergence Lookback Input Settings:
Lookback Left: Default: 10
What it is: The number of bars to look back from the current bar to detect a potential divergence.
What it does: Defines the left-side lookback period for identifying pivot points in the RSI, which are used to spot divergences. A longer lookback period may capture more significant trends but could also miss shorter-term divergences.
Example: A setting of 10 bars means the script will consider pivot points up to 10 bars before the current bar to check for divergence patterns.
Lookback Right: Default: 1
What it is: The number of bars to look forward from the current bar to complete the divergence pattern.
What it does: Defines the right-side lookback period for confirming a potential divergence. This setting helps ensure that the identified divergence is valid by allowing the script to check subsequent bars for confirmation.
Example: A setting of 1 bar means the script will look at the next bar to confirm the divergence pattern, ensuring that the signal is reliable.
Lookback Range Min: Default: 5
What it is: The minimum range of bars required to detect a valid divergence.
What it does: Sets a lower bound on the range of bars considered for divergence detection. A lower minimum range might capture more frequent but possibly less significant divergences.
Example: Setting the minimum range to 5 ensures that only divergences spanning at least 5 bars are considered, filtering out very short-term patterns.
Lookback Range Max: Default: 60
What it is: The maximum range of bars within which a divergence can be detected.
What it does: Sets an upper bound on the range of bars considered for divergence detection. A larger maximum range might capture more significant divergences but could also include less relevant long-term patterns.
Example: Setting the maximum range to 60 bars allows the script to detect divergences over a longer timeframe, capturing more extended divergence patterns that could indicate major trend reversals.
RSI Divergence Explanation
RSI divergences occur when the RSI indicator and price action move in opposite directions, signaling potential trend reversals. This section of the settings allows traders to customize the appearance and detection of both regular and hidden bullish and bearish divergences.
RSI Divergence Input Settings:
R. Bullish Div Label: Default: True
What it is: An option to display labels for regular bullish divergences.
What it does: Enables or disables the visibility of labels that mark regular bullish divergences, where the price makes a lower low while the RSI makes a higher low, indicating a potential upward reversal.
Example: A trader might use this to spot buying opportunities in a downtrend when a bullish divergence suggests the trend may be reversing.
Bullish Label Color, Line Width, and Line Color:
What it is: Settings to customize the appearance of regular bullish divergence labels.
What it does: Allows you to choose the color of the labels, adjust the width of the divergence lines, and select the color for these lines.
Example: Selecting a green label color and a distinct line width makes bullish divergences easily recognizable on your chart.
R. Bearish Div Label: Default: True
What it is: An option to display labels for regular bearish divergences.
What it does: Enables or disables the visibility of labels that mark regular bearish divergences, where the price makes a higher high while the RSI makes a lower high, indicating a potential downward reversal.
Example: A trader might use this to spot selling opportunities in an uptrend when a bearish divergence suggests the trend may be reversing.
Bearish Label Color, Line Width, and Line Color:
What it is: Settings to customize the appearance of regular bearish divergence labels.
What it does: Allows you to choose the color of the labels, adjust the width of the divergence lines, and select the color for these lines.
Example: Choosing a red label color and a specific line width makes bearish divergences clearly stand out on your chart.
H. Bullish Div Label: Default: False
What it is: An option to display labels for hidden bullish divergences.
What it does: Enables or disables the visibility of labels that mark hidden bullish divergences, where the price makes a higher low while the RSI makes a lower low, indicating potential continuation of an uptrend.
Example: A trader might use this to confirm an existing uptrend when a hidden bullish divergence signals continued buying strength.
Hidden Bullish Label Color, Line Width, and Line Color:
What it is: Settings to customize the appearance of hidden bullish divergence labels.
What it does: Allows you to choose the color of the labels, adjust the width of the divergence lines, and select the color for these lines.
Example: A softer green color with a thinner line width might be chosen to subtly indicate hidden bullish divergences, keeping the chart clean while providing useful information.
H. Bearish Div Label: Default: False
What it is: An option to display labels for hidden bearish divergences.
What it does: Enables or disables the visibility of labels that mark hidden bearish divergences, where the price makes a lower high while the RSI makes a higher high, indicating potential continuation of a downtrend.
Example: A trader might use this to confirm an existing downtrend when a hidden bearish divergence signals continued selling pressure.
Hidden Bearish Label Color, Line Width, and Line Color:
What it is: Settings to customize the appearance of hidden bearish divergence labels.
What it does: Allows you to choose the color of the labels, adjust the width of the divergence lines, and select the color for these lines.
Example: A muted red color with a thinner line width might be selected to indicate hidden bearish divergences without overwhelming the chart.
Divergence Text Size and Color: Default: S (Small)
What it is: Settings to adjust the size and color of text labels for RSI divergences.
What it does: Allows you to customize the size and color of text labels that display the divergence information on the chart.
Example: Choosing a small text size with a bright white color can make divergence labels easily readable without taking up too much space on the chart.
STOCHASTIC DIVERGENCES
Display of Stochastic RSI Divergence Labels:
Display of Stochastic RSI Divergence Settings:
Stochastic RSI Divergence Explanation
Stochastic RSI divergences occur when the Stochastic RSI indicator and price action move in opposite directions, signaling potential trend reversals. These settings allow traders to customize the detection and visual representation of both regular and hidden bullish and bearish divergences in the Stochastic RSI.
Stochastic RSI Divergence Input Settings:
R. Bullish Div Label: Default: True
What it is: An option to display labels for regular bullish divergences in the Stochastic RSI.
What it does: Enables or disables the visibility of labels that mark regular bullish divergences, where the price makes a lower low while the Stochastic RSI makes a higher low, indicating a potential upward reversal.
Example: A trader might use this to spot buying opportunities in a downtrend when a bullish divergence in the Stochastic RSI suggests the trend may be reversing.
Bullish Label Color, Line Width, and Line Color:
What it is: Settings to customize the appearance of regular bullish divergence labels in the Stochastic RSI.
What it does: Allows you to choose the color of the labels, adjust the width of the divergence lines, and select the color for these lines.
Example: Selecting a blue label color and a distinct line width makes bullish divergences in the Stochastic RSI easily recognizable on your chart.
R. Bearish Div Label: Default: True
What it is: An option to display labels for regular bearish divergences in the Stochastic RSI.
What it does: Enables or disables the visibility of labels that mark regular bearish divergences, where the price makes a higher high while the Stochastic RSI makes a lower high, indicating a potential downward reversal.
Example: A trader might use this to spot selling opportunities in an uptrend when a bearish divergence in the Stochastic RSI suggests the trend may be reversing.
Bearish Label Color, Line Width, and Line Color:
What it is: Settings to customize the appearance of regular bearish divergence labels in the Stochastic RSI.
What it does: Allows you to choose the color of the labels, adjust the width of the divergence lines, and select the color for these lines.
Example: Choosing an orange label color and a specific line width makes bearish divergences in the Stochastic RSI clearly stand out on your chart.
H. Bullish Div Label: Default: False
What it is: An option to display labels for hidden bullish divergences in the Stochastic RSI.
What it does: Enables or disables the visibility of labels that mark hidden bullish divergences, where the price makes a higher low while the Stochastic RSI makes a lower low, indicating potential continuation of an uptrend.
Example: A trader might use this to confirm an existing uptrend when a hidden bullish divergence in the Stochastic RSI signals continued buying strength.
Hidden Bullish Label Color, Line Width, and Line Color:
What it is: Settings to customize the appearance of hidden bullish divergence labels in the Stochastic RSI.
What it does: Allows you to choose the color of the labels, adjust the width of the divergence lines, and select the color for these lines.
Example: A softer blue color with a thinner line width might be chosen to subtly indicate hidden bullish divergences, keeping the chart clean while providing useful information.
H. Bearish Div Label: Default: False
What it is: An option to display labels for hidden bearish divergences in the Stochastic RSI.
What it does: Enables or disables the visibility of labels that mark hidden bearish divergences, where the price makes a lower high while the Stochastic RSI makes a higher high, indicating potential continuation of a downtrend.
Example: A trader might use this to confirm an existing downtrend when a hidden bearish divergence in the Stochastic RSI signals continued selling pressure.
Hidden Bearish Label Color, Line Width, and Line Color:
What it is: Settings to customize the appearance of hidden bearish divergence labels in the Stochastic RSI.
What it does: Allows you to choose the color of the labels, adjust the width of the divergence lines, and select the color for these lines.
Example: A muted orange color with a thinner line width might be selected to indicate hidden bearish divergences without overwhelming the chart.
Divergence Text Size and Color: Default: S (Small)
What it is: Settings to adjust the size and color of text labels for Stochastic RSI divergences.
What it does: Allows you to customize the size and color of text labels that display the divergence information on the chart.
Example: Choosing a small text size with a bright white color can make divergence labels easily readable without taking up too much space on the chart.
Alert System:
Custom Alerts for Divergences and Reversals:
What it is: The script includes customizable alert conditions to notify you of detected divergences or potential reversals based on WaveTrend, RSI, and Stochastic RSI.
What it does: Helps you stay informed of key market movements without constantly monitoring the charts, enabling timely decisions.
Example: Setting an alert for regular bearish divergence on the WaveTrend could notify you of a potential sell opportunity as soon as it is detected.
How to Use Alerts:
Set up custom alerts in TradingView based on these conditions to be notified of potential trading opportunities. Alerts are triggered when the indicator detects conditions that match the selected criteria, such as divergences or potential reversals.
By following the detailed guidelines and examples above, you can effectively use and customize this powerful indicator to suit your trading strategy.
For further understanding and customization, refer to the input settings within the script and adjust them to match your trading style and preferences.
How Components Work Together
Synergy and Cross-Validation: The indicator combines multiple layers of analysis to validate trading signals. For example, a WaveTrend buy signal that coincides with a bullish divergence in RSI and positive fast money flow is likely to be more reliable than any single indicator’s signal. This cross-validation reduces the likelihood of false signals and enhances decision-making.
Comprehensive Market Analysis: Each component plays a role in analyzing different aspects of the market. WaveTrend focuses on trend strength, Money Flow indicators assess market sentiment, while RSI and Stochastic RSI offer detailed views of price momentum and potential reversals.
Ideal For
Traders who require a reliable, multifaceted tool for detecting market trends and reversals.
Investors seeking a deeper understanding of market dynamics across different timeframes and conditions, whether in forex, equities, or cryptocurrency markets.
This script is designed to provide a comprehensive tool for technical analysis, combining multiple indicators and divergence detection into one versatile and customizable script. It is especially useful for traders who want to monitor various indicators simultaneously and look for convergence or divergence signals across different technical tools.
Acknowledgements
Special thanks to these amazing creators for inspiration and their creations:
I want to thank these amazing creators for creating there amazing indicators , that inspired me and also gave me a head start by making this indicator! Without their amazing indicators it wouldn't be possible!
vumanchu: VuManChu Cipher B Divergences.
MisterMoTa: RSI + Divergences + Alerts .
DevLucem: Plain Stochastic Divergence.
Note
This indicator is designed to be a powerful tool in your trading arsenal. However , it is essential to backtest and adjust the settings according to your trading strategy before applying it to live trading . If you have any questions or need further assistance, feel free to reach out.

All Divergences with trend / SL - Uncle SamThanks to the main inspiration behind this strategy and the hard work of:
"Divergence for many indicators v4 by LonesomeTheBlue"
The "All Divergence" strategy is a versatile approach for identifying and acting upon various divergences in the market. Divergences occur when price and an indicator move in opposite directions, often signaling potential reversals. This strategy incorporates both regular and hidden divergences across multiple indicators (MACD, Stochastics, CCI, etc.) for a comprehensive analysis.
Key Features:
Comprehensive Divergence Analysis: The strategy scans for regular and hidden divergences across a variety of indicators, increasing the probability of identifying potential trade setups.
Trend Filter: To enhance accuracy, a moving average (MA) trend filter is integrated. This ensures trades align with the overall market trend, reducing the risk of false signals.
Customizable Risk Management: Users can adjust parameters for long/short stop-loss and take-profit levels to match their individual risk tolerance.
Additional Risk Management (Optional): An experimental MA-based risk management feature can be enabled to close positions if the market shows consecutive closes against the trend.
Clear Visuals: The script plots pivot points, divergence lines, and stop-loss levels on the chart for easy reference.
Strategy Settings (Defaults):
Enable Long/Short Strategy: True
Long/Short Stop Loss %: 2%
Long/Short Take Profit %: 5%
Enable MA Trend: True
MA Type: HMA (Hull Moving Average)
MA Length: 500
Use MA Risk Management: False (Experimental)
MA Risk Exit Candles: 2 (If enabled)
Pivot Period: 9
Source for Pivot Points: Close
Backtest Details (Example):
The strategy has been backtested on XAUUSD 1H (Goold/USD 1 hour timeframe) with a starting capital of $1,000. The backtest period covers around 2 years. A commission of 0.02% per trade and a 0.1% slippage per trade were factored in to simulate real-world trading costs.
Disclaimer:
This strategy is for educational and informational purposes only. Backtested results are not indicative of future performance. Use this strategy at your own risk. Always conduct your own analysis and consider consulting a financial professional before making any trading decisions.
Important Notes:
The default settings are a good starting point, but feel free to experiment to find optimal parameters for your specific trading style and market.
The MA-based risk management is an experimental feature. Use it with caution and thoroughly test it before deploying in live trading.
Backtest results can vary depending on the market, timeframe, and specific settings used. Always consider slippage and commission fees when evaluating a strategy's potential profitability.

trendline function - JD!EXPERIMENTAL!
As TV doesn't provide a function to draw lines between points, I wrote a function to do this in one my own indicators.
The function itself however can be applied/modified for different use cases, eg. drawing trendlines.
In this (proof of concept) example I used it to draw lines based on past high/low pivot points.
The inputs required:
* an INPUT FUNCTION (in this form, its designed to work with functions that have occasional values and na-values between them, it then connects the non-zero values to form a line)
* a BOOL (to indicate if you want to draw only the rising or falling lines)
* a DELAY (in this case this is the lookback period for the pivot-points function, this is to compensate the calculation of the past and realtime points)
The function returns:
* the function to draw the extension from the BASE-LINE to the current time (here this is the connection of the last pivot-point to the current point to bridge the gap of the lookback period, this is NOT REALTIME!)
* the function to draw the extension for the current time (here this is the continuation of the line until a new pivot-point is valid, this is DRAWN IN REALTIME!!)
* the color of the lines (in this case the lines are only colored (lime or fuchsia) if they either go up or down, else they are invisible, this is to clean up the invalid lines)
these output functions can then simply be plotted using the 'plot' function.
JD.
Statistcal Daily Profile & Ranges# Statistical Daily Profile & Ranges - TradingView Publication Guide
## Overview
The **Statistical Daily Profile & Ranges** indicator is a comprehensive tool designed to analyze intraday session behavior and daily range characteristics. It combines Average Daily Range (ADR) projection levels with detailed session-by-session statistics and probability-based trading insights derived from historical price action patterns.
## What This Indicator Does
This indicator provides traders with three core analytical components:
1. **ADR Projection Levels** - Dynamic support/resistance levels based on historical daily ranges
2. **Session Range Analysis** - Visual boxes and statistical breakdowns for four key trading sessions
3. **Dynamic Probability Display** - Real-time probability statistics based on overnight session relationships
## How It Works
### Average Daily Range (ADR) Calculation
The indicator calculates the average daily range over a user-defined lookback period (default: 10 days) and projects this range from each day's opening price. This creates two key levels:
- **ADR High**: Opening price + average daily range
- **ADR Low**: Opening price - average daily range
- **ADR Median**: The opening price (middle of the projected range)
These levels are recalculated at the start of each trading day and extend forward, providing dynamic support and resistance zones based on recent volatility characteristics.
### Session Tracking & Statistics
The indicator monitors four distinct trading sessions (times in Eastern Time):
1. **Asia Session** (8:00 PM - 2:00 AM)
2. **London Session** (2:00 AM - 8:00 AM)
3. **NY Open** (8:00 AM - 9:00 AM)
4. **NY Initial Balance** (9:30 AM - 10:30 AM)
For each session, the indicator:
- Draws a colored box showing the session's high-to-low range
- Tracks the opening price, high, and low
- Stores historical data for statistical analysis
- Calculates average ranges by day of week (Monday through Friday)
The session statistics are displayed in a customizable table showing average point ranges for each session across different weekdays, helping traders identify which sessions and days typically produce the most movement.
### Dynamic Probability System
The indicator analyzes the relationship between the Asia and London sessions to determine the current market setup. After the London session closes, it automatically detects one of four possible conditions:
**1. London Engulfs Asia**
- London session breaks both above Asia's high AND below Asia's low
- This indicates strong momentum during the European session
- Most common occurrence pattern
**2. Asia Engulfs London**
- Asia session range completely contains the London session range
- Indicates consolidation during London hours
- Relatively rare pattern (occurs approximately 5.36% of the time)
**3. London Partially Engulfs Upwards**
- London breaks above Asia's high but stays above Asia's low
- Suggests bullish momentum continuation from Asia into London
**4. London Partially Engulfs Downwards**
- London breaks below Asia's low but stays below Asia's high
- Suggests bearish momentum continuation from Asia into London
Once a condition is detected, the indicator displays a probability table showing historically observed outcomes for that specific setup, including:
- Probability of NY session taking out key levels (Asia high/low, London high/low)
- Probability of NY session engulfing the entire overnight range
- Directional bias for NY Cash session (9:30 AM - 4:00 PM)
## How to Use This Indicator
### Initial Setup
1. Add the indicator to your chart (works on any intraday timeframe below Daily)
2. Adjust the **ADR Days** setting (default: 10) to control the lookback period for range calculation
3. Adjust the **Session Lookback Days** setting (default: 50) to determine how much historical data feeds the statistics tables
### Reading the ADR Levels
- Use the **ADR High** and **ADR Low** lines as potential profit targets or areas where price may encounter resistance
- The **ADR Median** line represents the opening price and can act as a pivot point for intraday directional bias
- If price reaches the ADR High early in the session, it suggests strong bullish momentum; conversely for ADR Low
- These levels adapt daily based on recent volatility, making them more responsive than static levels
### Interpreting Session Boxes
- **Session boxes** visually highlight when each trading session is active and its price range
- Larger boxes indicate higher volatility during that session
- Compare current session ranges to the statistical averages shown in the table
- Sessions that are unusually quiet or active relative to historical averages may signal compression or expansion
### Using the Session Statistics Table
- The table shows average point ranges for each session broken down by weekday
- Identify which sessions typically produce the most movement on specific days
- For example, if London on Thursdays averages 40 points while Mondays average 25 points, you can adjust position sizing or expectations accordingly
- The **Total** column shows the overall average across all days
- Sample sizes (shown in brackets if enabled) indicate data reliability
### Trading with the Probability Table
The probability table updates dynamically after the London session closes and shows statistically probable outcomes based on 12 years of NQ futures data.
**Important Limitations:**
- **These probabilities are derived from NQ (Nasdaq E-mini futures) data only**
- **Do NOT apply these probability statistics to other instruments** (ES, stocks, forex, etc.)
- The probabilities represent historical frequencies, not guarantees
- Always combine with your own analysis, risk management, and market context
**How to Apply the Probabilities:**
When **London Engulfs Asia**:
- Watch for NY session to take out London's extremes (72.33% probability for high, 71.12% for low)
- Slight bullish bias in NY Cash session (54.80% vs 45.20%)
- Lower probability of complete overnight engulfment (44.13%)
When **Asia Engulfs London** (rare - 5.36% occurrence):
- Higher probability NY takes Asia's high (75.86%)
- Moderately high probability NY takes Asia's low (65.52%)
- Slight increase in bullish bias (58.42% vs 41.58%)
- Recognize this as an unusual setup
When **London Partially Engulfs Upwards**:
- Very high probability NY takes London high (81.51%)
- Strong probability NY takes London low (64.45%)
- Moderate probability NY takes Asian low (53.16%)
- Slight bullish bias (55.52%)
When **London Partially Engulfs Downwards**:
- Very high probability NY takes London low (75.29%)
- Strong probability NY takes London high (68.80%)
- Moderate probability NY takes Asian high (56.44%)
- Slight bullish bias maintained (52.99%)
### Practical Trading Applications
**Scenario 1: Range Projection**
If the ADR is 500 points and the market opens at 25,000:
- ADR High: 25,500 (potential resistance/target)
- ADR Low: 24,500 (potential support/target)
- Monitor how price interacts with these levels throughout the day
**Scenario 2: Session-Based Trading**
Using the statistics table, you notice London on Wednesdays averages 35 points. During a Wednesday London session:
- If London has already moved 30 points, the session may be exhausting its typical range
- If London has only moved 15 points with an hour remaining, there may be expansion potential
- Adjust stop losses and targets based on typical session behavior
**Scenario 3: Probability-Based Setup**
It's 8:05 AM ET and the indicator shows "London Partially Engulfs Upwards":
- You now know there's an 81.51% historical probability NY will take out London's high
- There's a 53.16% probability NY will reach down to Asia's low
- The NY Cash session has a slight bullish bias (55.52%)
- Consider this alongside your technical analysis for directional bias and level targeting
## Customization Options
### Visual Settings
- **Line Width**: Adjust thickness of ADR levels
- **ADR Color/Style**: Customize appearance of ADR projection lines (solid, dashed, dotted)
- **Median Line**: Toggle visibility and customize appearance separately
- **Session Box Colors**: Customize each session's box color independently
- **Show Session Boxes**: Toggle session box visibility on/off
### Label Settings
- **ADR Labels**: Show/hide labels for ADR High and ADR Low, adjust size
- **Median Label**: Separate control for median line label
- **Session Labels**: Show/hide session name labels, adjust size
- **Label Colors**: Customize text colors for all labels
### Table Settings
- **Session Stats Table**: Position (9 locations available), size (Tiny to Huge), toggle on/off
- **Sample Sizes**: Show/hide the number of historical samples used for each calculation
- **Probabilities Table**: Separate position and size controls, toggle on/off
### Session Times
- Each session's time range can be customized to fit different markets or preferences
- All times are in Eastern Time (America/New_York timezone)
## Technical Notes
### Data Requirements
- The indicator requires sufficient historical data based on your lookback settings
- Minimum recommended: 50+ days of intraday data for reliable statistics
- Works on any timeframe below Daily (1-minute, 5-minute, 15-minute, etc.)
### Calculation Methodology
- **ADR Calculation**: Simple average of absolute daily high-low ranges
- **Session Statistics**: Mean average of ranges for each session filtered by day of week
- **Condition Detection**: Boolean logic comparing session high/low relationships
- All calculations update in real-time as new bars form
### Probability Data Source
The probability statistics displayed in the dynamic table are derived from:
- **Dataset**: 12 years of NQ (Nasdaq E-mini futures) historical data
- **Methodology**: Frequency analysis of outcomes following specific setup conditions
- **Time Period**: Multiple market cycles including various volatility regimes
**Critical Warning**: These probabilities are specific to NQ and reflect that instrument's behavior patterns. Market microstructure, participant behavior, and volatility characteristics differ significantly across instruments. Do not apply these NQ-derived probabilities to other markets (ES, RTY, YM, individual stocks, forex, commodities, etc.).
## Best Practices
1. **Combine with Other Analysis**: Use this indicator as one component of a complete trading methodology, not a standalone system
2. **Respect Risk Management**: Probabilities are not certainties; always use proper position sizing and stop losses
3. **Context Matters**: High-impact news events, holiday trading, and extreme volatility can invalidate typical patterns
4. **Verify Statistics**: Monitor your own results and compare to the displayed probabilities
5. **Adapt Session Times**: If trading instruments with different active hours, adjust session times accordingly
6. **Regular Calibration**: Periodically review if the session averages and probabilities remain relevant to current market conditions
## Understanding Originality
This indicator is original in its approach to combining three analytical frameworks into a single tool:
1. **Dynamic ADR Projection**: Unlike static pivot points, these levels adapt daily based on recent volatility
2. **Session-Specific Statistics**: Goes beyond simple volume profiles by quantifying average ranges for specific time windows across weekdays
3. **Conditional Probability Display**: Automatically detects overnight session relationships and displays relevant probability data rather than showing all scenarios simultaneously
The conditional logic system that determines which probability set to display is a key differentiator—traders only see the statistics relevant to the current market setup, reducing information overload and improving decision-making clarity.
## Summary
The **Statistical Daily Profile & Ranges** indicator provides traders with a comprehensive framework for understanding daily range potential, session-specific behavior patterns, and probability-based setup analysis. By combining ADR projection levels with detailed session statistics and dynamic probability displays, traders gain multiple perspectives on potential price movement within the trading day.
The indicator is most effective when used to:
- Set realistic profit targets based on average daily range
- Identify which sessions typically produce movement on specific weekdays
- Understand probability-weighted outcomes for different overnight setup conditions (NQ only)
- Visualize session ranges and compare them to historical averages
Remember that all statistical analysis reflects historical patterns, and market behavior can change. Always combine indicator signals with sound risk management, proper position sizing, and your own market analysis.

Support Resistance - Percentile LevelsKey Features:
1. Percentile Calculations:
The indicator calculates the 95th percentile (PercentilePlot100) and the 5th percentile (PercentilePlot5) of the high and low prices over specified lengths.
The lengths for these calculations are adjustable via input fields, allowing users to customize the periods used for percentile calculations.
2. Percentile Levels:
Resistance Levels (R1, R2, R3, R4): Plots resistance levels based on the 95th percentile of the high prices over different lengths (100, 200, 750, 4500).
Support Levels (S1, S2, S3, S4): Plots support levels based on the 5th percentile of the low prices over different lengths (100, 200, 750, 4500).
3. High-Timeframe Average:
Calculates and plots the average of the 750-period high and low percentiles (htfavg), which acts as a pivot point on the chart.
How to Use This Indicator:
1. Identify Key Support and Resistance Levels:
Use the plotted resistance (R1, R2, R3, R4) and support (S1, S2, S3, S4) levels to identify key areas where price may reverse or consolidate.
2. Pivot Point Analysis:
The plotted pivot point (htfavg) can be used to identify potential areas of trend change or consolidation. It represents the average price level based on higher timeframe percentiles.
3. Trend Analysis:
By observing how price interacts with these percentile levels, traders can gain insights into market trends and potential reversal points.
Customization:
The input fields allow you to customize the lengths of the percentiles and the percentile plot values according to your trading strategy and timeframe preference.
In summary, this indicator can help traders identify significant support and resistance levels, potential pivot points, and overall market trends based on percentile calculations of high and low prices over various periods. This can be valuable for making informed trading decisions and setting entry and exit points.
If you have any specific questions or need further customization, feel free to ask! 😊

Swing-Based VWAPSwing-Based VWAP
Summary:
The "Swing-Based VWAP" indicator enhances traditional VWAP calculations by incorporating swing-based logic. It dynamically adapts to market conditions by identifying key swing highs and lows and calculating VWAP levels around these pivot points. This makes it a versatile tool for traders seeking actionable price insights.
Explanation:
What is Swing-Based VWAP?
The Swing-Based VWAP is a modified version of the Volume-Weighted Average Price (VWAP). It calculates VWAP not only for a chosen timeframe (e.g., session, week) but also adapts dynamically to market swings. By identifying swing highs and lows, it offers more precise levels for potential price action.
Unique Features:
1. Dynamic Swing Integration:
- Uses pivot points to determine significant price levels.
- Calculates VWAP based on these points to adapt to market trends.
2. User-Friendly Settings:
- Includes options to hide VWAP on higher timeframes for chart clarity.
- Flexible swing size input for adjusting sensitivity.
How to Use:
1. Configuring Swing Settings:
- Use the "Swing Setting" input to determine the sensitivity of swing detection.
- Higher values identify broader swings, while smaller values capture more granular movements.
2. Enabling/Disabling VWAP:
- Toggle VWAP visibility using the "Use VWAP" option.
- The "Hide VWAP on 1D or Above" setting lets you control visibility on higher timeframes.
3. Anchor Period:
- Select your preferred anchoring period (e.g., session, week) to match your trading style.
4. Adjusting the Data Source:
- Use the "Source" input to select the price source (default: HLC3).
5. Visualizing Swing-Based VWAP:
- The script plots a dynamic VWAP line based on detected swing points.
- This line highlights average price levels weighted by volume and swing pivots.
ICT Market Structure Screener (Zeiierman)█ Overview
The ICT Market Structure Screener (Zeiierman) is designed to identify and display key market structure levels and patterns based on Smart Money Concepts. It highlights bullish and bearish structures, premium and discount levels, and generates alerts for significant market structure changes, making it a valuable tool for traders looking to understand institutional trading behaviors and market trends. A key feature of this indicator is its screener function, which allows traders to monitor multiple symbols simultaneously. This feature provides a consolidated view of the market structure for various assets, making it easier to identify trading opportunities across a diverse portfolio.
█ How It Works
The ICT Market Structure Screener operates by identifying high and low pivot points within a specified period, then analyzing these pivots to determine changes in market structure. The indicator tracks price movements and categorizes them into bullish or bearish structures, indicating potential trend reversals or continuations. By plotting premium and discount levels, it helps traders identify overbought and oversold conditions. The indicator also provides real-time updates and alerts for significant changes in the market structure.
█ Terminology
ChoCH (Change of Character): Indicates a potential reversal in market direction. It is identified when the price breaks a significant high or low, suggesting a shift from a bullish to bearish trend or vice versa.
SMS (Smart Money Shift): Represents the transition phase in market structure where smart money begins accumulating or distributing assets. It typically follows a BMS and indicates the start of a new trend.
BMS (Bullish/Bearish Market Structure): Confirms the trend direction. Bullish Market Structure (BMS) confirms an uptrend, while Bearish Market Structure (BMS) confirms a downtrend. It is characterized by a series of higher highs and higher lows (bullish) or lower highs and lower lows (bearish).
Premium: A zone where the price is considered overbought. It is calculated as the upper range of the current market structure and indicates a potential area for selling or shorting.
Mid Range: The midpoint between the high and low of the market structure. It often acts as a support or resistance level, helping traders identify potential reversal or continuation points.
Discount: A zone where the price is considered oversold. It is calculated as the lower range of the current market structure and indicates a potential area for buying or going long.
█ How to Use
The ICT Market Structure Screener allows traders to follow smart money moves in the market more effectively. By identifying key market levels and monitoring bullish and bearish structures, traders can easily spot trend changes and strong trends. The indicator's premium and discount levels help identify overbought and oversold conditions, providing valuable entry and exit points. Alerts for ChoCH, SMS, and BMS keep traders informed about significant market changes, enabling real-time adjustments to trading strategies.
The screener functionality is particularly valuable for monitoring multiple markets simultaneously. The screener table displays critical information such as current price, trend direction, signal type, and premium/discount levels for each symbol. This makes it easier to track the market structure of various assets at a glance and quickly identify trading opportunities across different markets.
Example Strategies:
⚪ Trend Following: Use the indicator to identify the current market trend (bullish or bearish) and trade in the direction of the trend. Enter trades on pullbacks to premium (for shorts) or discount (for longs) levels.
⚪ Reversal Trading: Look for ChoCH signals to identify potential trend reversals. Enter trades when the price breaks a significant high or low and confirms a change in market structure, or wait for a retest of the nearest Orderblock that was formed.
⚪ Support and Resistance: Utilize the mid-range, premium, and discount levels as support and resistance zones. Enter trades when the price approaches these levels and shows signs of reversal or continuation.
⚪ Multi-Symbol Analysis: Use the screener table to monitor multiple symbols and quickly assess their market structure. This helps in diversifying trading opportunities and managing a portfolio of assets efficiently.
█ Settings
Period: The pivot period for calculating the structure. Increasing the period captures broader trends, making the structure more representative of long-term movements. Decreasing the period focuses on shorter-term trends, increasing sensitivity.
Response: Enabling this option uses the response period instead of the pivot period, providing more flexibility in capturing short-term or long-term structures. The period for the response, which determines the structure's sensitivity. Increasing the response period smoothens the structure, making it less reactive to short-term fluctuations. Decreasing the response period makes the structure more responsive to short-term changes.
Structure Display: Choose between displaying the active range or the previous range. 'Active Range' shows real-time premium, discount, and mid-range levels based on the current structure. 'Previous Range' displays past ranges, useful for analyzing historical support/resistance levels.
Ticker Symbols: List of symbols to include in the screener. Enabling the option includes the symbol in the screener, allowing the user to track its structure. Disabling it excludes the symbol from the screener, reducing the number of tracked symbols.
-----------------
Disclaimer
The information contained in my Scripts/Indicators/Ideas/Algos/Systems does not constitute financial advice or a solicitation to buy or sell any securities of any type. I will not accept liability for any loss or damage, including without limitation any loss of profit, which may arise directly or indirectly from the use of or reliance on such information.
All investments involve risk, and the past performance of a security, industry, sector, market, financial product, trading strategy, backtest, or individual's trading does not guarantee future results or returns. Investors are fully responsible for any investment decisions they make. Such decisions should be based solely on an evaluation of their financial circumstances, investment objectives, risk tolerance, and liquidity needs.
My Scripts/Indicators/Ideas/Algos/Systems are only for educational purposes!

Support & Resistance ZonesTitle: A Comprehensive Guide to the Support & Resistance Zones Indicator
Introduction
In the world of technical analysis, the Support & Resistance Zones indicator plays a crucial role in identifying potential trading opportunities. These zones are essential for traders looking to capitalize on bounces or break and retests. In this article, we will delve into the specifics of the Support & Resistance Zones indicator, outlining how it works, how it finds and marks zones, and the various options available for traders.
What the indicator is about
The Support & Resistance Zones indicator, developed by @HarryCTC, is a powerful tool for detecting areas of potential price reversal or consolidation in a financial market. These zones are significant as they can act as a guide for traders to make informed decisions on entering or exiting positions. Specifically, the indicator helps identify:
1. Support Zones: Areas where the price has a tendency to bounce back up after falling, indicating a potential buying opportunity.
2. Resistance Zones: Areas where the price has a tendency to reverse after rising, indicating a potential selling opportunity.
How the indicator finds its zones
The Support & Resistance Zones indicator utilizes pivot points to identify potential support and resistance levels. By analyzing the fractal structure of the price chart, the indicator identifies key turning points, known as bull and bear fractals. The bull fractal is a high pivot point, while the bear fractal is a low pivot point.
The fractal structure is determined by the 'Switch Zone Period' input, which can be adjusted to suit the trader's preferences. A higher value will result in fewer zones being identified, while a lower value will result in more zones.
How it marks zones and why it marks zones
The indicator marks the support and resistance zones by creating rectangular boxes around the identified fractal points. The zones are extended horizontally from the fractal point, allowing traders to visualize the potential areas of price reversal.
The zones are marked for the following reasons:
1. To provide a clear visual representation of potential support and resistance levels.
2. To help traders identify potential entry and exit points based on the price's reaction to these zones.
3. To serve as a reference for stop-loss and take-profit levels when planning trades.
The indicator's for traders trading bounces or break and retests
Traders who focus on trading bounces or break and retests can benefit immensely from the Support & Resistance Zones indicator. By providing a visual representation of key support and resistance levels, the indicator enables traders to:
1. Identify potential buying opportunities at support zones where the price is likely to bounce back up.
2. Identify potential selling opportunities at resistance zones where the price is likely to reverse after rising.
3. Make informed decisions on stop-loss and take-profit levels based on the price's proximity to support and resistance zones.
4. Monitor the market for potential breakouts or breakdowns when the price breaches these zones.
Indicator options
The Support & Resistance Zones indicator offers several customizable options to suit the trader's preferences. These options include:
1. Switch Zone Period: Adjusts the number of periods used to calculate the fractal structure, influencing the number of identified zones.
2. No. of Displayed Zones: Determines the maximum number of zones displayed on the chart, ranging from 1 to 8.
3. Zone Extension: Adjusts the horizontal extension of the support and resistance zones.
4. Resistance Zone Color: Customizes the color of the resistance zone boxes.
5. Support Zone Color: Customizes the color of the support zone boxes.
6. Zone Border Color: Customizes the color of the zone box borders.
Conclusion
The Support & Resistance Zones indicator is a valuable tool for traders looking to identify potential trading opportunities based on the price's interaction with support and resistance levels. By providing a clear visual representation of these zones, the
indicator allows traders to make informed decisions on entry and exit points, stop-loss, and take-profit levels. With customizable options, the indicator can be tailored to suit individual trading preferences and strategies.
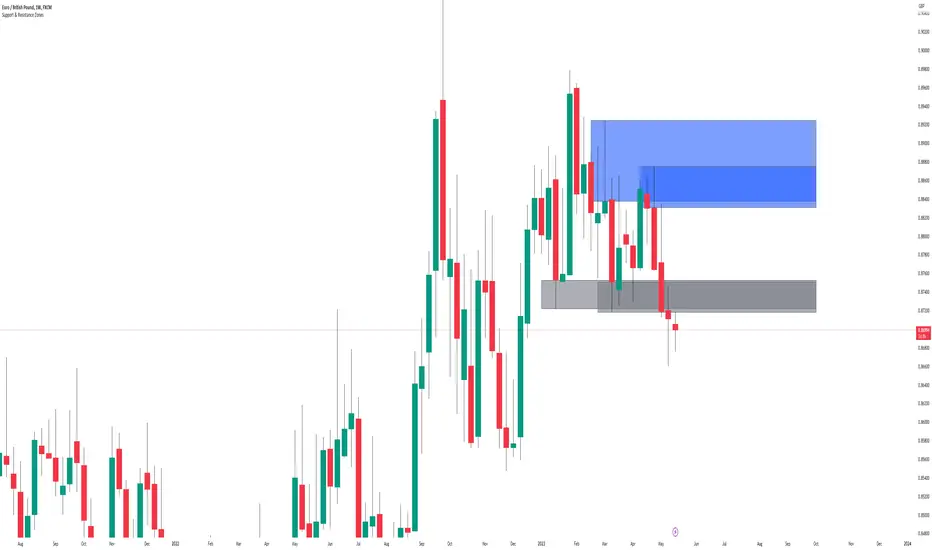
Cup & HandleHi, here is my take on 'Cup & Handle'
Pivot Points - ph (highest points in a certain period) are stored in an array
When there is a new ph , previous ph's are compared to the latest one.
A temporary test line is drawn between these 2 points.
The script checks if a close (between these 2 points) doesn't break above this test line.
(test line is deleted afterwards)
If it doesn't, and the '% max breaks' are not breached, 2 circle shaped lines are drawn
(Top & Bottom line of the cup) which forms the Cup, together with the Handle.
The red box (Handle) is the maximum 33-50% retracement (% of cup height)
-> Only the latest pattern is shown, enabling 'Show Cup labels' shows the position of cup patterns in history.
They can be visualised by using 'Bar Replay'
'% max breaks' -> 'maximum highs/lows breaking through the Top/Bottom line
(% of bars between left & right extreme points of the Cup)
Settings:
- 'Left', 'Right' -> regulates Pivot Point values
- 'PP back' -> max lookback for Pivot High
More explanation can be found in following print screens,
or by checking the tooltips in the settings
Cheers!

Pivot Clouds [SS]Hey everyone,
Whopper indicator here that I have been working on for some time, excited to finally release it! So let's get into it!
☁️☁️ What are Pivot Clouds?! ☁️☁️
The concept for pivot clouds came from trailing and erroring different iterations of support and resistance (which ultimately led to the creation of the BIN Based Support and Resistance indicator).
In the design and creation of my BIN support and resistance indicator, I initially tried to do something similar with pivot points. However, I found pivots to be relatively ineffective as support and resistance, especially in very trendy markets, and the BIN approach reigned supreme. However, not wanting to abandon the utility of pivots, I tried something different, creating a pivot based SMA.
This proved most useful and very helpful for determining directions, rejections and trends! From there, came this indicator, the Pivot Clouds. This is currently iteration 32 haha, which will be the final iteration for the time being and most functional.
The pivot cloud indicator works by smoothing pivot highs and pivot lows over the course of your inputted length. My general suggestion is to keep it between 150 to 250. Going to low will make it incredibly choppy. Using 200 seems to be the sweet spot for most tickers.
Over the course of the pivot lookback, it collects all pivot highs and pivot lows, then averages them out to create 2 separate SMAs, those being an SMA for the pivot high and an SMA for the pivot low. Together, these create the cloud you see in the main chart.
In addition to creating this cloud, the indicator marks and tracks pivot maxes to both the upside and downside and will draw cloud support on a fall below the main cloud and cloud resistance on a rise above the main cloud, as exampled here:
Above:
And Below:
These clouds represent the average of the pivot high/pivot low and extend to the max or min (high or low depending on position on the main cloud).
💡 Alternative Abilities 💡
Resulting from the sometimes inadequacy of pivots to determine targets and resistance/support, the indicator is capable of pulling in ATR target prices. This allows the user to either use both, pivot max/min clouds AND ATR targets, or simply one or the other.
The ATR targets can be customized in the indicator settings, with a default of daily timeframe targets on a 14 ATR lookback.
Here are some examples of how the ATR targets look:
And to the upside:
📈 Standalone Strategy 📈
This indicator can be used as a standalone strategy, or to complement other strategies. I will go over both briefly, starting with standalone strategy:
Select your target preference (ATR, Pivot Maxes and Mins or both)
Long on a break and hold over the main cloud to the targets; or
Shrot on a break below the main cloud to the targets.
That simple!
🎯Supplemental to existing Strategy 🎯
This indicator for me is gold for my strategy, which involves longing or shorting to calculated target prices.
You essentially follow the above, only your targets are determined by your strategy. So for me, I look for a rejection or hold of the cloud, to long or short to my targets:
💰Customizing the Indicator 💰
Let's quickly go over these options:
Smooth length: Creates a smooth cloud. Suggested limits are 150 - 250
Lookback Length: This determines the length of lookback for the indicator to store historical pivot information and create the clouds.
Pivot Lookforward/backward: Allows the user to select custom pivot timeframes. The traditional rule is 10, but 5 sometimes is preferred on larger timeframes.
Show Pivot Max and Min: These enables the pivot max and min cloud for a crossover or crossunder of the main cloud.
ATR timeframe: determines the ATR target price levels to look for. You can toggle weekly, daily, hourly, whichever you prefer.
ATR Length: Allows you to customize the lookback for determining the ATR targets.
USE ATR targets: This will turn on / off the ATR targets, if you wish to use/not use these reference points with the indicator, same as with the pivot max and min cloud toggle.
And that's the indicator, folks!
Hope you like it,
Take care and safe trades!🚀

Adaptive RSI with Real-Time Divergence [AIBitcoinTrend]👽 Adaptive RSI Trailing Stop (AIBitcoinTrend)
The Adaptive RSI Trailing Stop is an indicator that integrates Gaussian-weighted RSI calculations with real-time divergence detection and a dynamic ATR-based trailing stop. This advanced approach allows traders to monitor momentum shifts, identify divergences early, and manage risk with adaptive trailing stop levels that adjust to price action.
👽 What Makes the Adaptive RSI with Signals and Trailing Stop Unique?
Unlike traditional RSI indicators, this version applies a Gaussian-weighted smoothing algorithm, making it more responsive to price action while reducing noise. Additionally, the trailing stop feature dynamically adjusts based on volatility and trend conditions, allowing traders to:
Detects real-time divergences (bullish/bearish) with a smart pivot-based system.
Filter noise with Gaussian weighting, ensuring smoother RSI transitions.
Utilize crossover-based trailing stop activation, for systematic trade management.
👽 The Math Behind the Indicator
👾 Gaussian Weighted RSI Calculation
Traditional RSI calculations rely on simple averages of gains and losses. Instead, this indicator weights recent price changes using a Gaussian distribution, prioritizing more relevant data points while maintaining smooth transitions.
Key Features:
Exponential decay ensures recent price changes are weighted more heavily.
Reduces short-term noise while maintaining responsiveness.
👾 Real-Time Divergence Detection
The indicator detects bullish and bearish divergences using pivot points on RSI compared to price action.
👾 Dynamic ATR-Based Trailing Stop
Bullish Trailing Stop: Activates when RSI crosses above 20 and dynamically adjusts based on low - ATR multiplier.
Bearish Trailing Stop: Activates when RSI crosses below 80 and adjusts based on high + ATR multiplier
This allows traders to:
Lock in profits systematically by adjusting stop-losses dynamically.
Stay in trades longer while maintaining adaptive risk management.
👽 How It Adapts to Market Movements
✔️ Gaussian Filtering ensures smooth RSI transitions while preventing excessive lag.
✔️ Real-Time Divergence Alerts provide early trade signals based on price-RSI discrepancies.
✔️ ATR Trailing Stop dynamically expands or contracts based on market volatility.
✔️ Crossover-Based Activation enables the stop-loss system only when RSI confirms a momentum shift.
👽 How Traders Can Use This Indicator
👾 Divergence Trading
Traders can use real-time divergence detection to anticipate reversals before they happen.
Bullish Divergence Setup:
Look for RSI making a higher low, while price makes a lower low.
Enter long when RSI confirms upward momentum.
Bearish Divergence Setup:
Look for RSI making a lower high, while price makes a higher high.
Enter short when RSI confirms downward momentum.
👾 Trailing Stop Signals
Bullish Signal and Trailing Stop Activation:
When RSI crosses above 20, a trailing stop is placed using low - ATR multiplier.
If price crosses below the stop, it exits the trade and removes the stop.
Bearish Signal and Trailing Stop Activation:
When RSI crosses below 80, a trailing stop is placed using high + ATR multiplier.
If price crosses above the stop, it exits the trade and removes the stop.
This makes trend-following strategies more efficient, while ensuring proper risk management.
👽 Why It’s Useful for Traders
✔️ Dynamic and Adaptive: Adjusts to changing market conditions automatically.
✔️ Noise Reduction: Gaussian-weighted RSI reduces short-term price distortions.
✔️ Comprehensive Strategy Tool: Combines momentum detection, divergence analysis, and automated risk management into a single indicator.
✔️ Works Across Markets & Timeframes: Suitable for stocks, forex, crypto, and futures trading.
👽 Indicator Settings
RSI Length: Defines the lookback period for RSI smoothing.
Gaussian Sigma: Controls how much weight is given to recent data points.
Enable Signal Line: Option to display an RSI-based moving average.
Divergence Lookback: Configures how far back pivot points are detected.
Crossover/crossunder values for signals: Set the crossover/crossunder values that triggers signals.
ATR Multiplier: Adjusts trailing stop sensitivity to market volatility.
Disclaimer: This indicator is designed for educational purposes and does not constitute financial advice. Please consult a qualified financial advisor before making investment decisions.

The Strat [LuxAlgo]The Strat indicator is a full toolkit regarding most of the concepts within "The Strat" methodology with features such as candle numbering, pivot machine gun (PMG) highlighting, custom combo highlighting, and various statistics included.
Alerts are also included for the detection of specific candle numbers, custom combos, and PMGs.
🔶 SETTINGS
Show Numbers on Chart: Shows candle numbering on the chart.
Style Candles: Style candles based on the detected number. Only effective on non-line charts and if the script is brought to the front.
🔹 Custom Combo Search
Combo: User defined combo to be searched by the script. Combos can be composed of any series of numbers including (1, 2, -2, 3), e.g : 2-21. No spaces or other characters should be used.
🔹 Pivot Machine Gun
Show Labels: Highlight detected PMGs with a label.
Min Sequence Length: Minimum sequence length of consecutive higher lows/lower highs required to detect a PMG.
Min Breaks: Minimum amount of broken previous highs/lows required to detect a PMG.
Show Levels: Show levels of the broken highs/lows.
🔹 Pivot Combos
Pivot Lookback: Lookback period used for detecting pivot points.
Right Bars Scan: Number of bars scanned to the right side of a detected pivot.
Left Bars Scan: Number of bars scanned to the left side of a detected pivot.
🔹 Dashboard
Show Dashboard: Displays statistics dashboard on chart.
Numbers Counter: Displays the numbers counter section on the dashboard.
Pivot Combos: Displays pivots combo section on the dashboard.
%: Display the percentage of detected pivot combos on the dashboard instead of absolute numbers.
Pivot Combos Rows: Number of rows displayed by the "Pivots Combo" dashboard section.
Show MTF: Showa MTF candle numbering on the dashboard.
Location: Location of the dashboard on the chart.
Size: Size of the displayed dashboard.
🔶 USAGE
This script allows users with an understanding of The Strat to quickly highlight elements such as candle numbers, pivot machine guns, and custom combos. The usage for these concepts is given in the sub-sections below.
🔹 Candle Numbers
The Strat assigns a number to individual candles, this number is determined by the current candle position relative to the precedent candle, these include:
Number 1 - Inside bar, occurs when the previous candle range engulfs the current one.
Number 2 Up - Upside Directional Bar, occurs when the current price high breaks the previous high while the current low is lower than the previous high.
Number 2 Down - Downside Directional Bar, occurs when the current price low breaks the previous low while the current high is higher than the previous low.
Number 3 - Outside bar, occurs when the current candle range engulfs the previous one.
The script can highlight the number of a candle by using labels but can also style candles by depending on the candle number. Inside bars (1) only have their candle wick highlighted, directional bars (2) (-2) only have their candle body highlighted. Outside bars have their candle range highlighted.
Note that downside directional bars are highlighted with the number -2.
Users can see the total amount of times a specific candle number is detected on the historical data on the dashboard available within the settings, as well as the number of times a candle number is detected relative to the total amount of detected candle numbers expressed as a percentage.
It is also possible to see the current candle numbers returned by multiple timeframes on the dashboard.
🔹 Searching For Custom Combos
Combos are made of a sequence of two or more candle numbers. These combos can highlight multiple reversals/continuation scenarios. Various common combos are documented by The Strat community.
This script allows users to search for custom combos by entering them on the Combo user setting field.
When a user combo is found, it is highlighted on the chart as a box highlighting the combo range.
🔹 Pivot Combos
It can be of interest to a user to display the combo associated with a pivot high/low. This script will highlight the location of pivot points on the chart and display its associated combo by default. These are based on the Pivot Combo lookback and not displayed in real-time.
Users can see on the dashboard the combos associated with a pivot high/low, these are ranked by frequency.
🔹 Pivot Machine Gun (PMG)
Pivot Machine Guns (PMG)s describe the scenario where a single price variation breaks the value of multiple past successive higher lows/lower highs. This can highlight a self-exciting behavior, where even more past successive higher lows/lower highs get broken.
Users can select the minimum sequence length of successive higher lows/lower highs required for a PMG to be detected, as well the amount of these successive higher lows/lower highs that must be broken.

MTF Trend WidgetThis indicator identifies trends in multiple higher timeframes (D, W, M) and shows them in a widget off to the right of the chart.
It's meant to be used as an alternative filter for "trading with the trend." Typically people use moving averages of varying lengths for this (i.e. if over 200 MA it's an uptrend, etc.), but I wanted to see if it might be more effective to see if the higher timeframes were actually trending or not in a certain direction.
For the purposes of this indicator, an uptrend is defined as higher highs and higher lows. So if currently in a downtrend and the highs are broken, the indicator will flip to an uptrend because now we have a higher high. Vice versa for downtrends.
The user can choose the lookback period for defining these highs/lows (the pivot points). A smaller lookback number will give you more frequent pivot points.
The user can toggle on visibility of all historical pivot points to make sure the frequency and placement of the swing highs/lows is to their liking.
The user can show the support/resistance lines of those most recent swing high/low points on the multiple timeframes as well.
When these lines are breached, that is when the trends change, so you can see if you are close to changing any longer term trends.
My hope is that this gives people a quick glance at the overall trend without having to cycle through different timeframes.

Price Action - Support & Resistance by DGTSᴜᴘᴘᴏʀᴛ ᴀɴᴅ Rᴇꜱɪꜱᴛᴀɴᴄᴇ , is undoubtedly one of the key concepts of technical analysis
█ Sᴜᴘᴘᴏʀᴛ ᴀɴᴅ Rᴇꜱɪꜱᴛᴀɴᴄᴇ Dᴇꜰɪɴɪᴛɪᴏɴ
Support and Resistance terms are used by traders to refer to price levels on charts that tend to act as barriers, preventing the price of an financial instrument from getting pushed in a certain direction.
A support level is a price level where buyers are more aggressive than sellers. This means that the price is more likely to "bounce" off this level rather than break through it. However, once the price has breached this level it is likely to continue falling until meeting another support level.
A resistance level is the opposite of a support level. It is where the price tends to find resistance as it rises. Again, this means that the price is more likely to "bounce" off this level rather than break through it. However, once the price has breached this level it is likely to continue rising until meeting another resistance level.
A previous support level will sometimes become a resistance level when the price attempts to move back up, and conversely, a resistance level will become a support level as the price temporarily falls back.
█ Iᴅᴇɴᴛɪꜰʏɪɴɢ Sᴜᴘᴘᴏʀᴛ ᴀɴᴅ Rᴇꜱɪꜱᴛᴀɴᴄᴇ
Support and resistance can come in various forms, and the concept is more difficult to master than it first appears. Identification of key support and resistance levels is an essential ingredient to successful technical analysis.
If the price stalls and reverses in the same price area on minimum of two different occasions, then a horizontal line is drawn to show that the market is struggling to move past that area. Those areas are static barriers, one of the most popular forms of support/resistance and are highlighted with horizontal lines.
Repeated test , the more often a support/resistance level is "tested" over an extended period of time (touched and bounced off by price), the more significance is given to that specific level
High volume , the more buying and selling that has occurred at a particular price level, the stronger the support or resistance level is likely to be
Market psychology , plays a major role as traders and investors remember the past and react to changing conditions to anticipate future market movement.
Psychological levels , is a price level that significantly affects the price of an underlying financial instrument. Typically, near round numbers often serve as support and resistance
The following support and resistance related topics are beyond the scope of this study, so they will be mentioned roughly only as a reference for support and resistance concept
Trendlines , Support and resistance levels in trends are dynamic. Throughout an uptrend, levels of support tend to look like a trendline, usually clustering around higher lows. As the price rises, the price where buyers consider the stock to be “too cheap” also changes, which creates new support levels on the way up. The same is also true for resistance levels. In an uptrend, a stock is continuously breaking through perceived resistance levels and making new highs
Moving Averages , is a constantly changing line that smooths out past price data while also allowing the trader to identify support and resistance. In the example Notice how the price of the asset finds support at the moving average when the trend is up, and how it acts as resistance when the trend is down
The Fibonacci Retracement/Extension tool , is a favorite among many short-term traders because it clearly identifies levels of potential support and resistance
Pivot Point Calculations , is another common technical analysis technique, where pivot point is calculated based on the high, low, and closing prices of previous trading session/day and support & resistance levels are projected based on the pivot point, different calculation techniques are available, as presented in this example of an pivot point indicator : PVTvX by DGT
█ Tʀᴀᴅɪɴɢ Bᴀꜱᴇᴅ ᴏɴ Sᴜᴘᴘᴏʀᴛ ᴀɴᴅ Rᴇꜱɪꜱᴛᴀɴᴄᴇ
Once an area or "zone" of support or resistance has been identified, those price levels can serve as potential entry or exit points because, as a price reaches a point of support or resistance, it will do one of two things—bounce back away from the support or resistance level (trading ranges), or violate the price level and continue in its direction (trading breakouts) —until it hits the next support or resistance level
The basic trading method for using support and resistance is to buy near support in uptrends or the parts of ranges or chart patterns where prices are moving up and to sell/sell short near resistance in downtrends or the parts of ranges and chart patterns where prices are moving down. Buying near support or selling near resistance can pay off, but there is no assurance that the support or resistance will hold. Therefore, consider waiting for some confirmation that the market is still respecting that area
Trading breakouts, a breakout is a potential trading opportunity that occurs when an asset's price moves above a resistance level or moves below a support level on increasing volume. The first step in trading breakouts is to identify current price trend patterns along with support and resistance levels in order to plan possible entry and exit points. Once the asset trades beyond the price barrier, volatility tends to increase and prices usually trend in the breakout's direction. Breakouts are such an important trading strategy since these setups are the starting point for future volatility increases, large price swings and, in many circumstances, major price trends. When trading breakouts, it is important to consider the underlying asset's support and resistance levels. The more times an asset price has touched these areas, the more valid these levels are and the more important they become. At the same time, the longer these support and resistance levels have been in play, the better the outcome when the asset price finally breaks out. Asset prices will often move slightly further than we expect them to. This doesn't happen all the time, but when it does it is called a false breakout. Therefore it is important to consider waiting for some confirmation while trading breakouts. It’s also popular for traders to sell 50% of their positions at the resistance level, and hold the rest in anticipation of a breakout above resistance
█ Pʀɪᴄᴇ Aᴄᴛɪᴏɴ - Sᴜᴘᴘᴏʀᴛ & Rᴇꜱɪꜱᴛᴀɴᴄᴇ ʙʏ DGT Sᴛᴜᴅʏ
This experimental study attempts to identify the support and resistance levels. Assumes a simple logic to discover moments where the price is rising or falling consecutively for minimum 3 bars with the condition volume increases on each bar and the last bar’s volume should be bigger than the long term volume moving average. A line will be drawn at the end of the move (highest or lowest, depending on the move direction), the line will be drawn at minimum on the 3rd bar and if condition holds for other consecutive bars the line will switch to 4th, 5th etc bar.
Lines will not be deleted so the historical ones will remain and will emphasis the levels significance when they overlap in feature. Strong levels are more likely to hold and cause the price to move in the other direction, whereas the minor levels may only cause the price to pause and keep moving in the same direction. Determining future levels of support and resistance can drastically improve the returns of a short-term investing strategy
Bar colors will be painted based on the volume of the specific bar to its long term volume moving average. This will help identifying the support and resistance levels significance and emphasis the sings of breakouts
Finally, Volume spikes will be marked on top of the price chart. A high volume usually indicates more interest in the security and the presence of institutional traders. However, a rapidly rising price in an uptrend accompanied by a huge volume may be a sign of exhaustion. Traders usually look for breaks of support and resistance to enter positions. When security break critical levels without volume , you should consider the breakout suspect and prime for a reversal off the highs/lows. Volume spikes are often the result of news-driven events. Volume spike will often lead to sharp reversals since the moves are unsustainable due to the imbalance of supply and demand
A good example with many support and resistance concepts observed on a stock chart and detected by the study
Settings:
Length of volume moving average, where volume moving average is used to detect support and resistance levels, is used as reference to compare with threshold values for volume spikes and colors of the bars
Hint, to get more historical lines scrolling chart to left will enable visualization of them. Please note they may appear to much all 500 line limit is used 😉
Special thanks to @HEMANT Telegram user, for his observations and suggestions
Disclaimer:
Trading success is all about following your trading strategy and the indicators should fit within your trading strategy, and not to be traded upon solely
The script is for informational and educational purposes only. Use of the script does not constitute professional and/or financial advice. You alone have the sole responsibility of evaluating the script output and risks associated with the use of the script. In exchange for using the script, you agree not to hold dgtrd TradingView user liable for any possible claim for damages arising from any decision you make based on use of the script

Ind-Suite: The Ultimate Strategic Dashboard [Gap/Dow/MA/SR]概要 Ind-Suiteは、トレードに必要な4つの重要な要素(窓、市場構造、移動平均線、水平線)を1つのインジケーターに統合した包括的なトレーディング・スイートです。 このツールの目的は、単一のサインに頼るのではなく、複数の根拠が重なる「コンフルエンス(Confluence)」を視覚的に発見することにあります。
機能モジュール 設定画面の「⚡ MODULE TOGGLES ⚡」から、各モジュールのON/OFFを瞬時に切り替えられます。
Module A: Gaps (窓)
未埋めの窓(Gap)をボックスで表示します。
価格が引き寄せられるターゲットとして機能します。一定期間経過した窓は自動的に非表示になります。
Module B: Dow Structure (ダウ理論と構造)
ZigZagラインによる波の描画と、トレンド状態の判定。
BOS (Break of Structure): トレンド継続のブレイクポイントにラベルを表示。
下落トレンド時は背景色が変化し、視覚的にトレンドを把握できます。
Module C: Safe Scaffold (足場と勢い)
EMA (9/20) & VWAP: トレンドフォローのための主要な移動平均線。
Bollinger Bands: ボラティリティの確認用(ON/OFF可能)。
Signal: EMAクロスとバンド幅拡大(スクイーズからのエクスパンション)を検知したロングサインを表示。
Module D: S/R Guardian (水平線)
過去のPivot点をベースに、意識されやすいサポート・レジスタンスラインを自動描画します。
強度に基づいてラインが統合され、重要度が高い価格帯を可視化します。
推奨される使い方 すべてのモジュールを常にONにする必要はありません。チャートが情報過多にならないよう、必要な機能だけを選択して表示してください。 例えば、「S/Rライン」での反発、「Dow Structure」でのBOS、「Gap」の埋め完了など、3つ以上の根拠が重なるポイントは、優位性の高いエントリーポイントとなります。
--------------
Overview Ind-Suite is a comprehensive trading suite that integrates four essential elements (Gaps, Market Structure, Moving Averages, and Support/Resistance) into a single indicator. The goal of this tool is not to rely on a single signal, but to visually identify "Confluence" where multiple factors align.
Feature Modules You can instantly toggle each module ON/OFF via the "⚡ MODULE TOGGLES ⚡" in the settings.
Module A: Gaps
Highlights unclosed gaps with boxes.
These act as price magnets/targets. Old gaps are automatically hidden after a set period.
Module B: Dow Structure (Trend & Market Structure)
Draws ZigZag waves and determines trend status based on pivot points.
BOS (Break of Structure): Labels are displayed at key breakout points confirming trend continuation.
Background color changes during downtrends for instant visual recognition.
Module C: Safe Scaffold (Momentum & MAs)
EMA (9/20) & VWAP: Key moving averages for trend following.
Bollinger Bands: For volatility analysis (Toggle available).
Signal: Displays Long signals upon EMA crossover combined with BBW expansion (volatility breakout).
Module D: S/R Guardian (Support & Resistance)
Automatically draws S/R zones based on historical pivot points.
Levels are merged based on proximity, visualizing significant price zones.
Recommended Usage It is not necessary to keep all modules ON at all times. Toggle features as needed to keep your chart clean. High-probability setups are often found where multiple factors converge (Confluence). For example: A bounce off an "S/R Line," confirmed by a "BOS" in Dow Structure, coinciding with a "Gap" fill.
